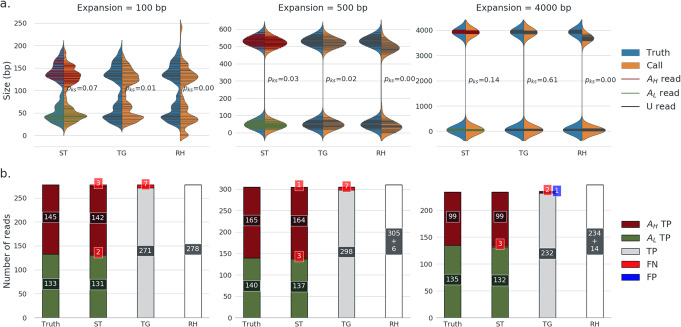
Fig. 1.
Genotyping benchmark (simulated data): repeat capture. a Repeat size distribution of genotyping results from Straglr (ST), tandem-genotypes (TG) and RepeatHMM (RH) compared against real sizes (Truth) in simulated samples. Each sample is composed of 17 heterozygous loci (Table 1) with a reference and expanded alleles. Violin plot of each tool (orange, right) is juxtaposed with violin plot of the real distribution (blue, left) in each of the nine samples with different expansion sizes. Horizontal lines within the violin plot indicate the actual repeat sizes (y-positions) and relative frequencies (widths) detected. Red lines indicate sizes classified (ST) or generated (Truth) as the expanded allele (AH), green the reference (AL) allele, and black unclassified. PKS indicates the p value from a KS test comparing the tool’s estimated and truth repeat size distributions. b True-positive (TP), false-positive (FP), and false-negative (FN) histograms in each of the nine experiments. Classifications are separated for expanded (dark red) and reference (green) alleles in ST based on the reported genotypes. No classification is possible with RH as supporting read identities were not revealed. Numbers in RH just indicate the total number of Truths reads plus the difference detected; e.g., 305 + 6 indicate 311 reads in total were detected by RH, 6 more than the total truth

