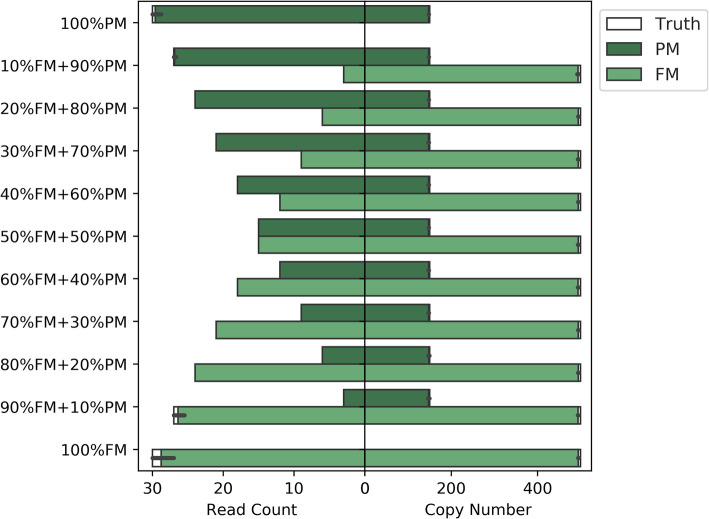
Fig. 3.
FXS mosaicism simulation. The Y-axis labels specify the composition of full (FM) and premutation (PM) alleles in each mosaic sample simulated. The left panel plots the number of reads simulated (white) overlaid by the number of reads assigned by Straglr for each allele (green) in each sample. The right panel plots the copy number(s) simulated (white) overlaid by Straglr’s reported copy number(s) (green) for each sample. The horizontal length of each green bar represents the average of results from ten samples of the same composition and the error bar represents the 95% confidence interval. Thirty simulated reads spanning the FMR1 repeat locus with the specified allele composition is used as the input for each experiment. FM allele has 500 repeats and PM has 150 repeats

