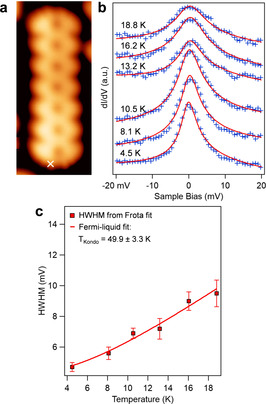
Figure 3.

a) STM image of Por7 NT (V s=−0.05 V, I t=320 pA), b) Temperature evolution of the Kondo spectra, with the experimental data (blue crosses) fit by the Frota function (red curves). Data have been acquired at the position marked by a cross in (a) (V mod=0.8 mV). c) Extracted half width at half maximum (HWHM) of the Kondo resonance as a function of temperature. The data are fit by the Fermi‐liquid model to determine the Kondo temperature.
