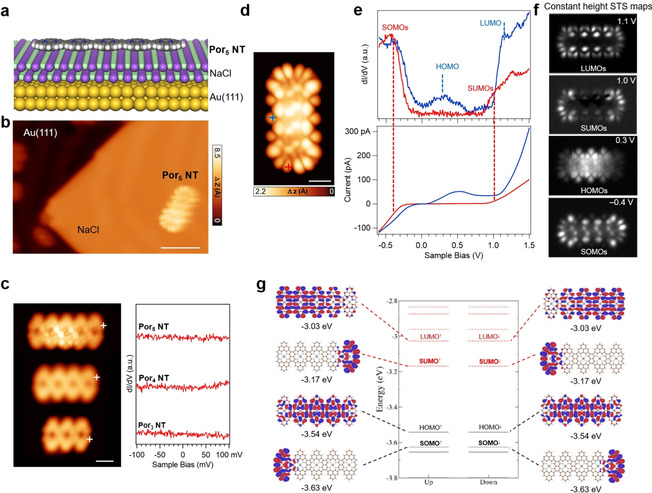
Figure 4.

a) Model illustrating Por5 NT on a thin insulating NaCl bilayer supported by Au(111). b) STM image of Por5 NT transferred onto NaCl/Au(111) (V s=−0.2 V, I t=12 pA). Scale bar: 4 nm. c) (Left) STM images of Por5 NT pentamer, Por4 NT tetramer, and Por3 NT trimer (from top to bottom) on NaCl/Au(111), and (right) the corresponding low‐energy dI/dV spectra acquired at their termini (positions indicated by white crosses in (c). Set points: for Por5 NT: V s=−0.1 V, I t=20 pA; for Por4 NT: V s=−0.1 V, I t=8 pA; for Por3 NT: V s=0.1 V, I t=6 pA. Scale bar: 1 nm. d) STM image of Por5 NT on NaCl/Au(111) (V s=−0.6 V, I t=120 pA). Scale bar: 1 nm. e) Differential conductance dI/dV and simultaneously acquired current (I/V) spectra recorded over the Por5 NT (acquisition positions indicated by crosses in (d). f) Constant‐height STS maps at different bias voltages, as indicated. Set points from top to bottom: V s=0.1 V, I t=6 pA; V s=0.1 V, I t=6 pA; V s=0.1 V, I t=6 pA; V s=−0.1 V, I t=6 pA. g) Spin‐polarized DFT calculated molecular orbitals and energy levels of Por5 NT in gas phase (the antiferromagnetic case is shown). There are two degenerate SOMO and SUMO states, which are spatially located at the ends of the tape. SOMO is found to be shifted below the HOMO of Por5 NT.
