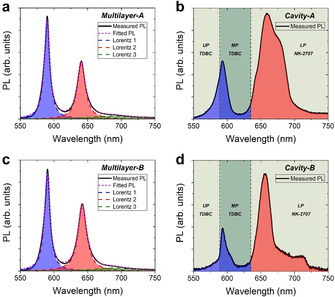
Figure 3.

Angle‐integrated PL of a) Multilayer‐A, b) Cavity‐A, c) Multilayer‐B and d) Cavity‐B, when excited at 405 nm using a CW laser diode. In parts (a) and (c) we fit the PL with 3 Lorentz curves where blue represents PL from TDBC and red and green represent PL from NK‐2707. A convolution of the 3 Lorentz curves is shown in magenta. Parts (b) and (d) show shaded areas in blue and red that we associate with polariton PL emission from TDBC and NK‐2707 respectively. The green shaded areas mark the wavelength range of the various LPB, MPB and UPB given by our coupled oscillator model. The dashed vertical lines represent the peak wavelength of the two excitons.
