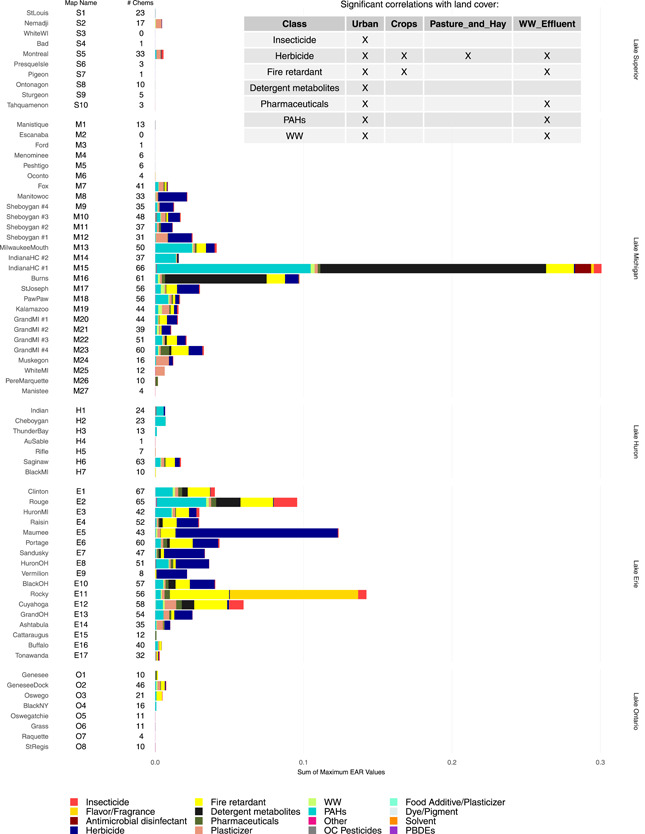
Figure 4.

Maximum exposure–activity ratios (EARs) by chemical class computed from passive sampler chemistry data from 69 Great Lakes tributary sites collected in 2010 and 2014 for chemicals included in the ToxCast database. An “X” in the embedded table indicates major land cover within the watersheds that were significantly correlated with exceedance of an EAR threshold of 10–3 for chemical classes. Chemical classes not represented in the table did not have significant correlations. “Map Name” shows reference locations included on the map in Figure 1; “# Chems” shows number of chemicals with computed EAR values.
