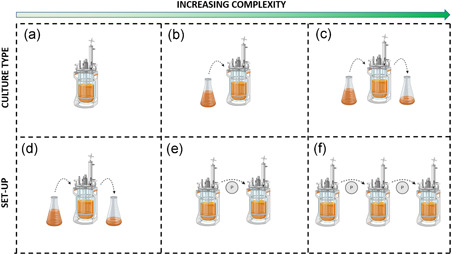
Figure 3.

Schematic representation of the microbiota culture methods with increasing level of complexity, including batch (a), fed‐batch (b), and continuous culture (d). The bioreactors for continuous culture of microbiota were classified accordingly to the number of vessels: single‐, double‐ and triple‐stage bioreactors (d, e and f, respectively). Figure made with biorender (https://biorender.com) [Color figure can be viewed at wileyonlinelibrary.com]
