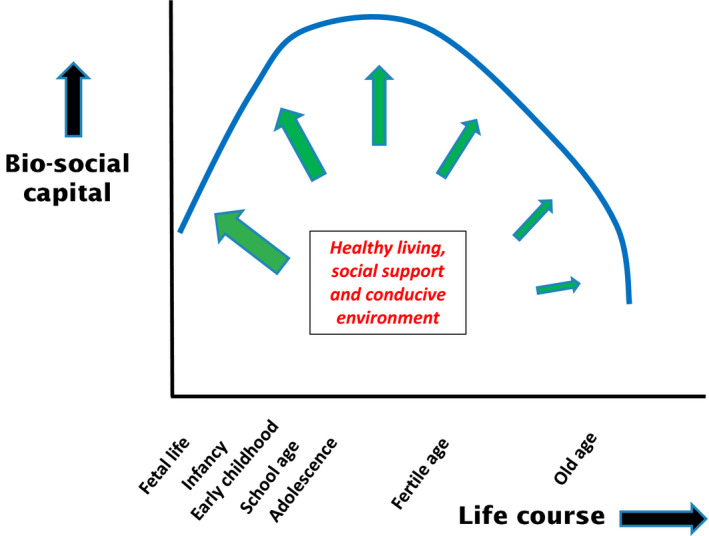
FIGURE 3.

Illustration of the bio‐social life course in terms of chronological age and ‘bio‐social capital’ comprising a combination of phenotypic fitness or resilience and social resources. The blue curve shows how the bio‐social capital life course increases in early years and declines again in old age. It may be sustained or improved by levels of healthy living, social or medical support and conducive environment, as indicated by the green arrows which are drawn thicker earlier in the life course in order to indicate a larger scope for change
