
FIG. 2.
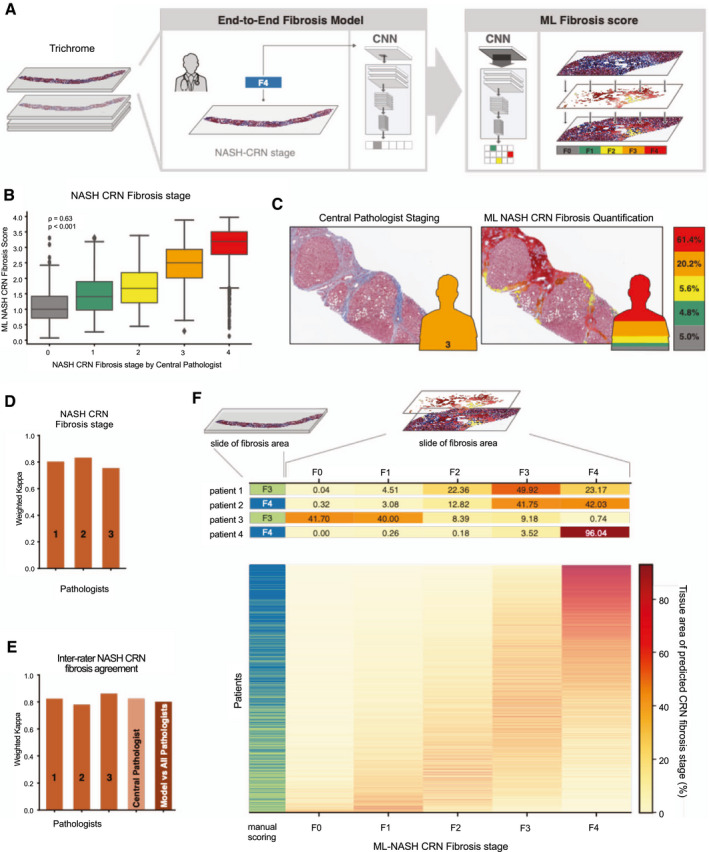
ML system for staging of fibrosis. (A) ML process for training and deploying models for fibrosis staging. Model is trained using the CP’s ordinal fibrosis stage (NASH CRN 0‐4 and Ishak 0‐6, middle panel). The model performs pixel‐wise prediction, and these predictions are pooled over the entire slide to yield a per‐slide prediction and distribution of fibrosis stages (left panel). (B) Box‐and‐whisker plots showing comparison of ordinal stage based on evaluation by the CP (x‐axis) and ML‐based model measurement (y‐axis). The ML‐based measurement is the weighted average NASH CRN fibrosis stage based on model predictions (Materials and Methods). Spearman correlation coefficients (rho) and corresponding P values are inset. Boxes show the IQR, and whiskers show 1.5× the limit of the IQR. Points show values beyond this range. (C) Example pathological image with and without ML‐based heatmap and stacked bar chart. Pixel‐wise predictions of NASH CRN fibrosis stage are shown on the left (gray = 0, green = 1, yellow = 2, orange = 3, and red = 4). Height of bar chart represents percentage of tissue classified as each fibrosis stage. (D) Intrapathologist reproducibility for NASH CRN fibrosis stage. Values shown are weighted Cohen’s kappa computed for repeated staging of the same slides (N = 166). (E) Pathologist and model inter‐rater agreement for staging of fibrosis. Bar charts show the weighted Cohen’s kappa for each pathologist’s score and the model’s score against the consensus of pathologists. (F) Heterogeneity of fibrosis within patients with advanced fibrosis (F3‐F4) attributable to NASH. Leftmost column represents the CP’s single ordinal stage (green = F3 and blue = F4). Middle panel shows a heatmap where each row is a patient and each column is an ML NASH CRN predicted stage. The color of each box represents the percentage of that patient’s biopsy, which is predicted to be consistent with each NASH CRN fibrosis stage (0‐4).