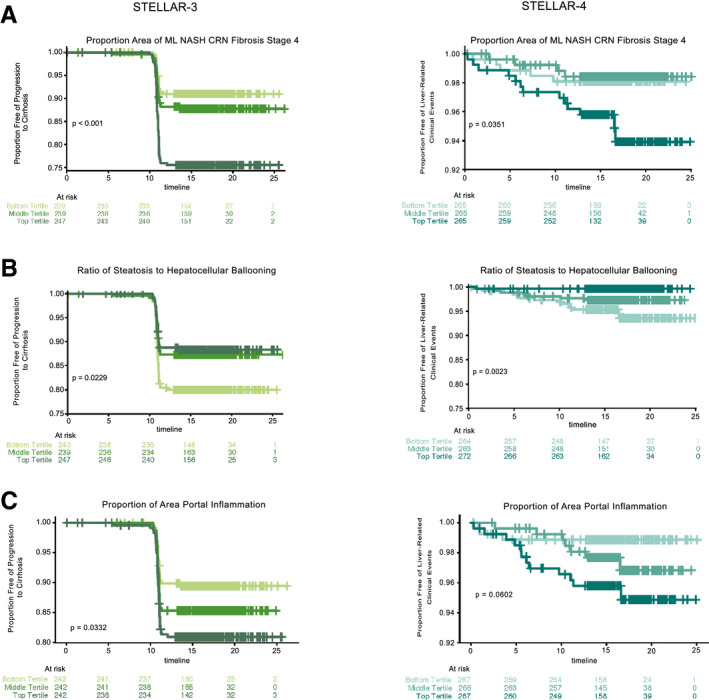
FIG. 3.

Application of ML features for assessing prognosis and monitoring responses to treatment and disease progression. Kaplan‐Meier curves showing proportions of patients with bridging fibrosis (F3) without progression to cirrhosis (left panel, STELLAR‐3) or patients with cirrhosis (F4) without liver‐related clinical events (right panel, STELLAR‐4) over time. Patients are categorized into subgroups by tertile of (A) percentage of area predicted to be NASH CRN stage 4, (B) ratio of steatosis to HB, and (C) percent area of portal inflammation based on ML predictions. Tertiles are shown by shades of green (STELLAR‐3) and blue (STELLAR‐4), with the lightest shades indicating the bottom tertile and darkest shades the top tertile. P values were computed using the log‐rank test.
