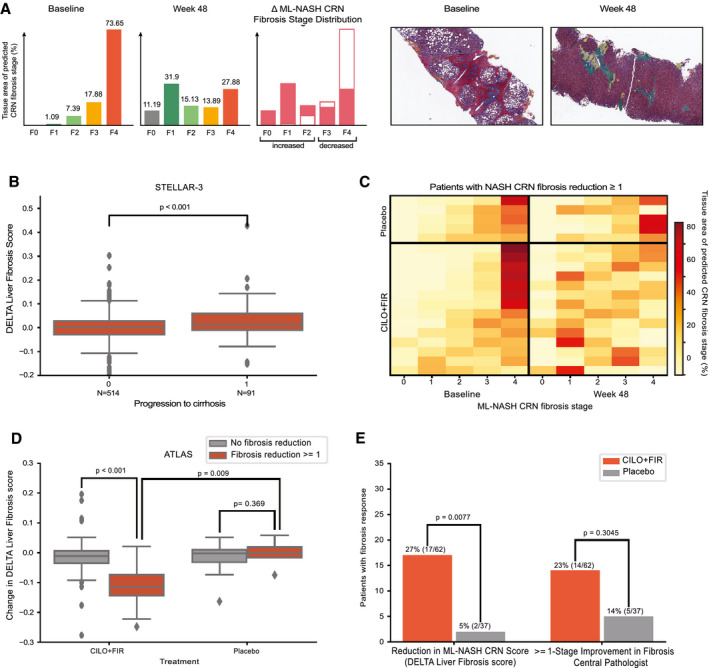
FIG. 4.

(A) Example quantification of changes in fibrosis from advanced (F3‐F4) to less‐advanced (≤F2) fibrosis stage patterns for a patient treated with the CILO + FIR in the ATLAS trial. Sample regions with heatmaps are shown at baseline and week 48 below. (B) Box‐and‐whisker plot showing the difference in DELTA Liver Fibrosis score for patients who did and did not progress to cirrhosis at week 48 in STELLAR‐3. (C) Heatmap showing the change in percentage of each fibrosis stage pattern between baseline and week 48 in biopsies from patients in the placebo (top) and CILO + FIR (bottom) arms of the ATLAS trial. Each row represents a patient, all of whom were determined by the CP to have had a ≥1‐stage improvement in NASH CRN fibrosis stage. Each column is an ML NASH CRN predicted fibrosis stage. The color of each box represents the percentage of that patient’s biopsy, which is predicted to be consistent with each NASH CRN fibrosis stage (0‐4) at baseline (left) and at week 48 (right). (D) Box‐and‐whisker plot showing the DELTA Liver Fibrosis score for patients in the placebo and CILO + FIR arms of the ATLAS trial according to achievement of a ≥1‐stage improvement in fibrosis according to the CP. (B,D) P values for comparisons of change in DELTA Liver Fibrosis score between groups was computed using the Mann‐Whitney U test. Boxes show the interquartile range (IQR), and whiskers show 1.5× the limit of the IQR. (E) Bar chart showing the proportion of patients in the placebo (gray) and CILO + FIR arms (red) of the ATLAS study with a reduction in fibrosis as assessed by the DELTA Liver Fibrosis score and according to the CP using the NASH CRN classification. P values computed using Fisher’s exact test.
