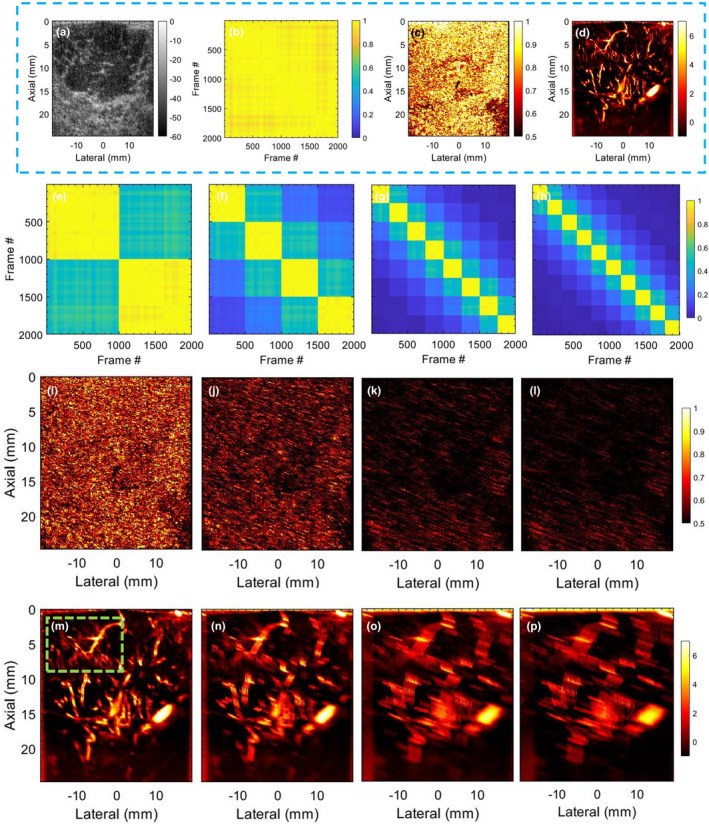
Fig. 3.

Results of motion simulation study, performed using breast ultrasound data with no prior motion. (a) displays sonogram of the breast lesion. (b,c) display the corresponding spatiotemporal correlation matrix (STCM) and local spatiotemporal correlation (LSTC) image, respectively. (d) displays the respective contrast‐free microvascular blood flow (MBF) image of the breast lesion. The STCMs (e‐h), LSTC images (i‐l), and MBF images (m‐p) correspond to simulated Cases 1‐4, respectively. The green box in (w) indicates the ROI chosen for analysis in Fig. 4.
