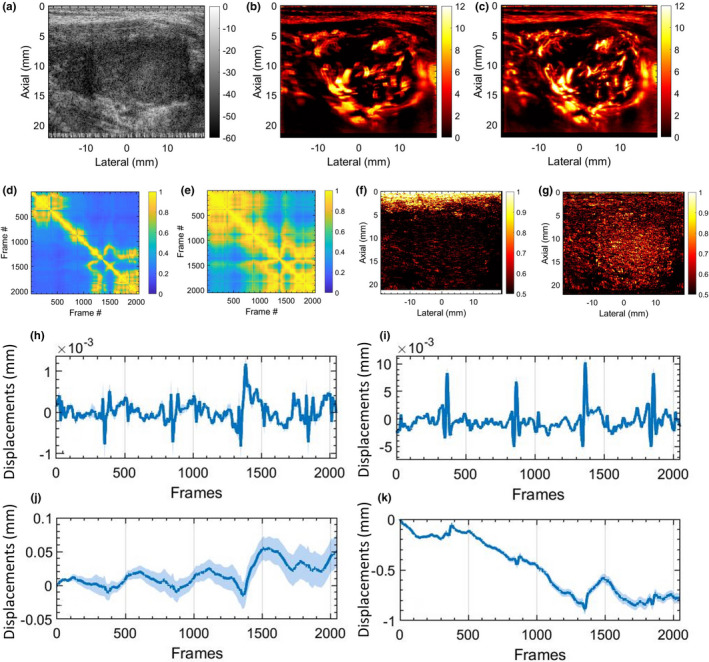
Fig. 6.

In vivo thyroid results with motion correction. (a) displays the thyroid sonogram. (b) displays the corresponding microvascular blood flow (MBF) image, corrupted with motion artifacts. (c) displays the motion‐corrected MBF image with reduced motion artifacts. (d,e) display the corresponding spatiotemporal correlation matrix, before and after motion correction, respectively. (f,g) displays the corresponding local spatiotemporal correlation images, before and after motion correction, respectively. (h,i) display the mean axial and lateral displacements estimated in the lesion area, between consecutive frame pairs. (j,k) display the accumulated axial and lateral displacement estimates, with respect to the first ensemble frame. The continuous error bars in (h‐k) correspond to 1 standard deviation of the displacement estimates in the lesion area.
