
Fig. 8.
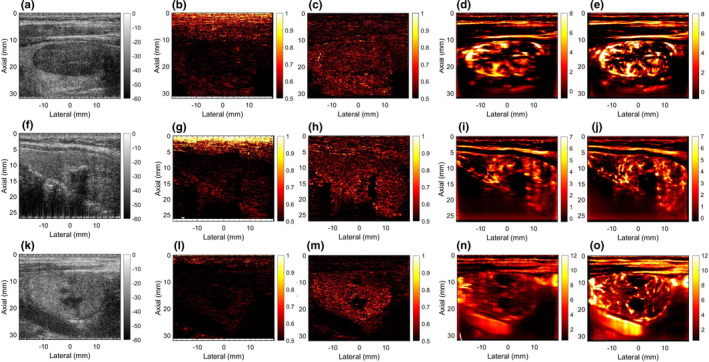
Rows 1–3 display five examples of thyroid microvascular blood flow (MBF) imaging, respectively. Column 1 displays the sonogram. Column 2 and 3 display the local spatiotemporal correlation images estimated without and with motion correction, respectively. Columns 4 and 5 display the MBF images estimated without and with motion correction, respectively.