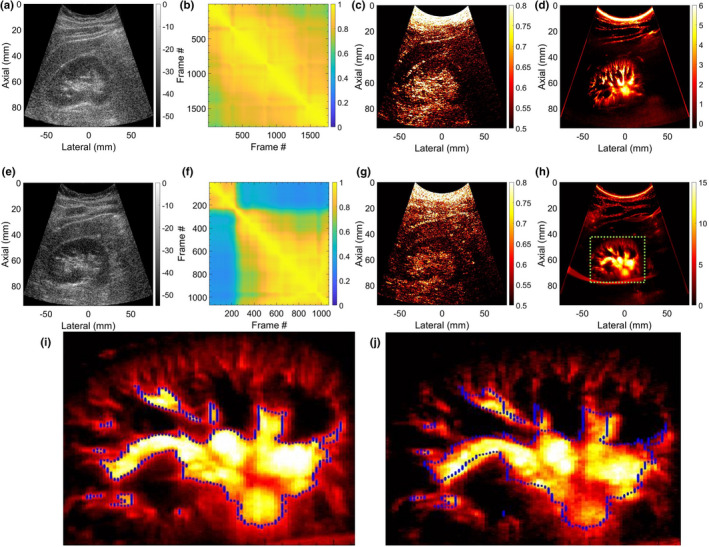
Fig. 10.

Two representative examples of scan converted renal microvascular blood flow (MBF) imaging using a curved array probe are displayed in Rows 1 and 2, respectively. (a,e) display the scan converted sonograms of the kidney. (b,f) display the spatiotemporal correlation matrix images quantifying temporal coherency of the Doppler ensemble with respect to the pixels corresponding to the renal area. (c,g) display the scan converted local spatiotemporal correlation images quantifying spatial coherency of the Doppler ensemble across the entire imaging plane. (d,h) display the respective scan converted renal microvascular blood flow (MBF) images. (i,j) correspond to MBF images of the second renal example (e‐h), estimated by integrating frames (236‐2064,1‐235) of the clutter‐filtered Doppler ensemble, respectively. The blue outline display the lack of registration between the MBF images (i,j), even though estimated from the same ensemble.
