Fig. 11.

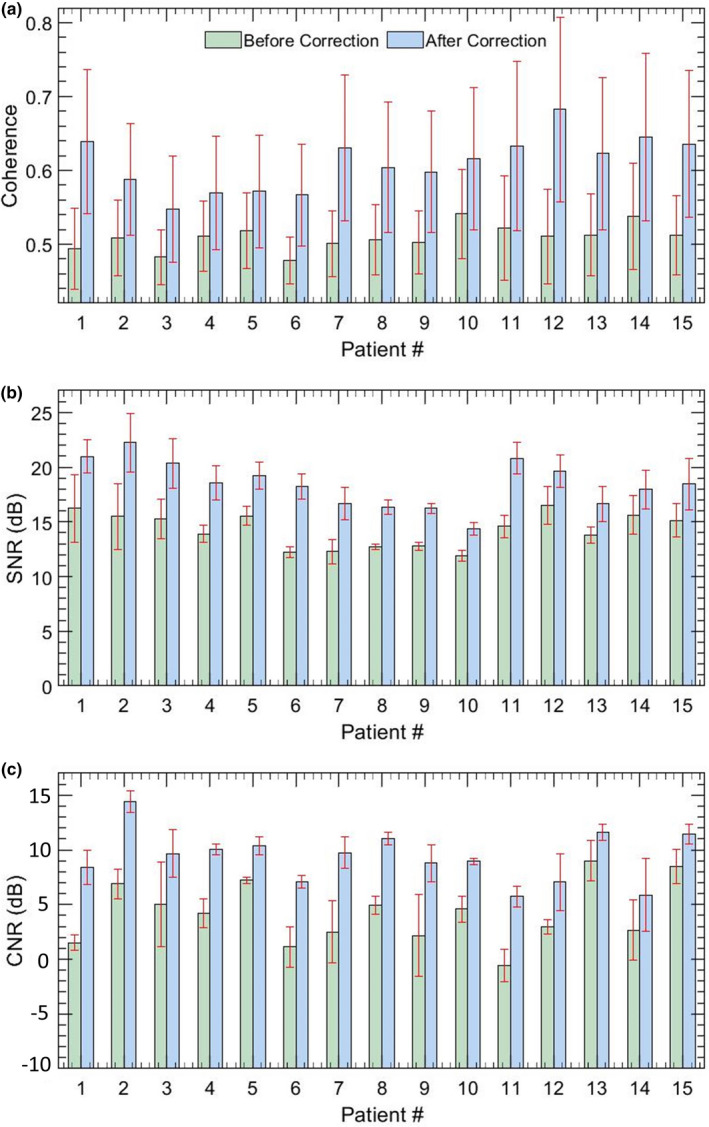
Quantitative estimates of microvascular blood flow image quality for 15 in vivo thyroid patients. Barplots (a,b) display the mean and 1 standard deviation of SNR and CNR measured without and with motion correction.

Quantitative estimates of microvascular blood flow image quality for 15 in vivo thyroid patients. Barplots (a,b) display the mean and 1 standard deviation of SNR and CNR measured without and with motion correction.