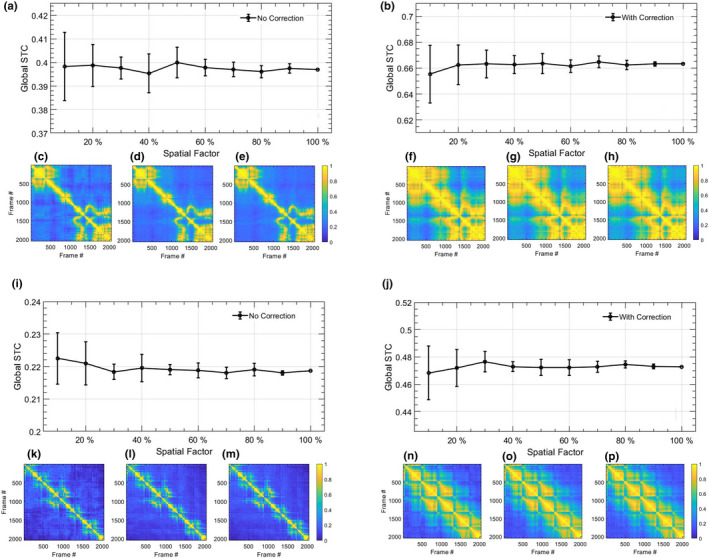
Fig. 13.

Impact of estimating spatiotemporal correlation matrix (STCM) from spatially downsampled Doppler ensemble. (a‐h) and (i‐p) corresponds to two examples of in vivo thyroid microvascular blood flow imaging, displayed in Figs. 6 and 7, respectively. Left and right columns of each thyroid example correspond to the Doppler ensemble without and with motion correction, respectively. The line‐plots (a,b,i,j) display the mean STCM estimated from a downsampled lesion ROI, with 10–100 of pixel density. Error bars are estimated across 10 random sampling of the ROI data points. (c,f,k,n), (d,g,l,o), and (e,h,m,p) display representative STCM images obtained with 10, 50, and 100 of ROI pixels. Color bar for (c‐h) and (k‐p) are uniform.
