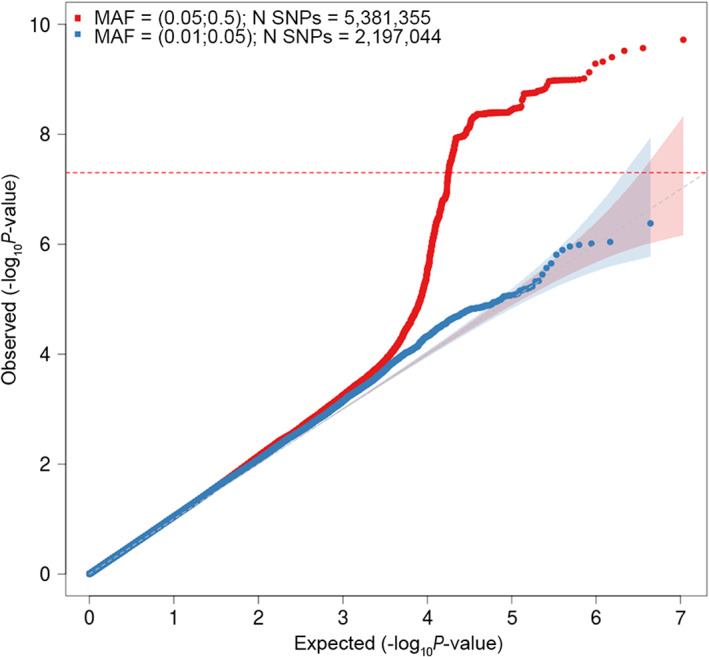
FIGURE 2.

Quantile‐quantile (QQ) plot for association with cluster headache (CH). The horizontal axis shows ‐log10 p values expected under the null distribution. The vertical axis shows observed ‐log10 p values. Red = common SNPs (MAF ≥0.05), blue = low frequency SNPs (MAF = 0.005–0.05). Genomic inflation factor (λ) = 1.069. MAF = minor allele frequency; SNPs = single nucleotide polymorphisms. [Color figure can be viewed at www.annalsofneurology.org]
