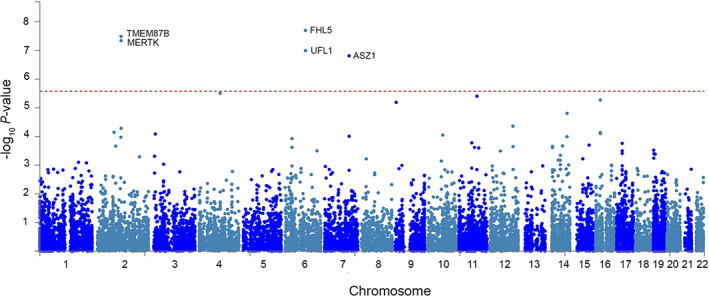
FIGURE 3.

Gene‐based Manhattan plot. Input SNPs were mapped to 18,795 protein coding genes. The horizontal axis shows the chromosomal position and the vertical axis shows the significance of tested markers. The threshold for genome wide significance (p = 0.05/18,795 = 2.66 × 10⁻⁶) is indicated by a dotted line. SNP = single nucleotide polymorphism. [Color figure can be viewed at www.annalsofneurology.org]
