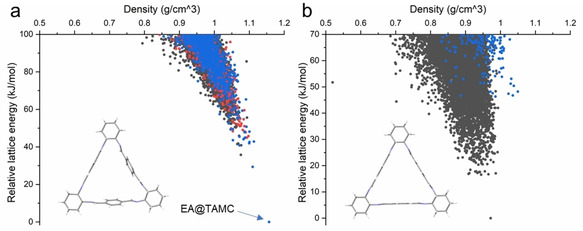
Figure 4.

Crystal structure prediction (CSP) landscapes for a 1 : 1 composition of EA:TAMC in 6 common space groups (a) using the conformation from the experimentally determined EA@TAMC crystal structure; (b) using the calculated gas phase minimum conformer from a conformational search (Figure S25). Each point here corresponds to a predicted crystal structure that is a local minimum on the lattice energy surface. The color‐coding of structures is given by the positioning of the EA molecule relative to the TAMC cavity. Red dots represent structures in which the methyl end of EA sits inside TAMC, blue dots are structures where the ethyl end of EA is inside the TAMC cavity and black dots are structures where EA is outside TAMC. Note that there are no red dots in (b).
