
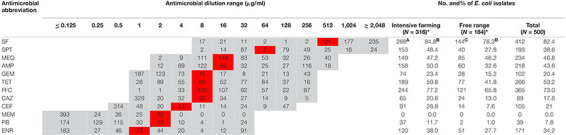
TABLE 2.
MIC distribution of E. coli (N = 500) and prevalence of resistance by isolation source.
|
SF, Sulfisoxazole; SPT, Spectinomycin; MEQ, Mequindox; AMP, Ampicillin; GEM, Gentamycin; TET, Tetracyclines; FFC, Florfenicol; CAZ, Ceftazidime; CEF, Ceftiofur; MEM, Meropenem; PB, Polymyxin B; ENR, Enrofloxacin.
Gray and red colors indicate applied dilution ranges and breakpoints, respectively.
* Statistically significant difference (P < 0.05) between intensive farming and free-range (expect mequindox).
A and C define intensive farming (Ningxia and Shaanxi) and free-range (Qinghai and Inner Mongolia) isolates showing microbial resistance, that is, MIC value higher than breakpoint.
B and D represent the percentage of drug-resistant strains in intensive farming and free-range, respectively.