
Figure 6.
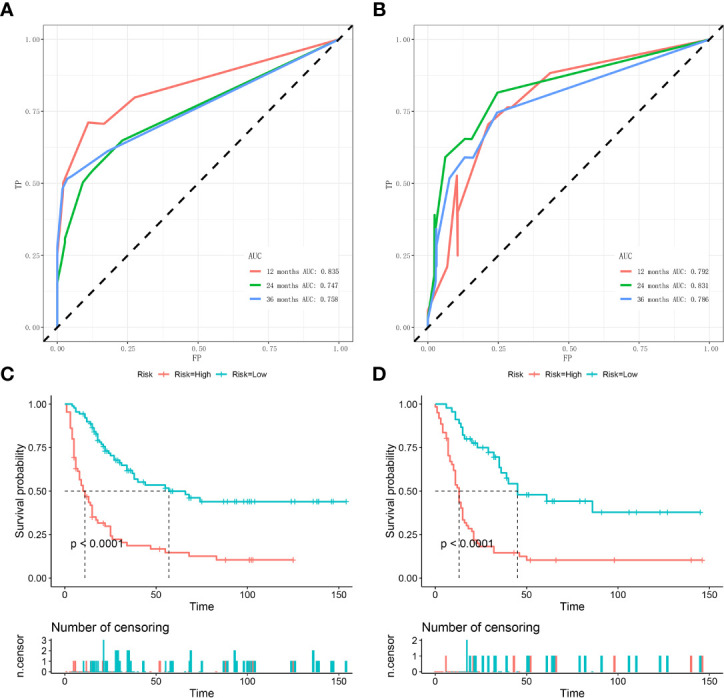
Time-dependent ROC curve analysis of the nomogram for the 12, 24, and 36 months in the training set (A) and the validation set (B). The Kaplan–Meier survival curves of the patients in the training set (C) and in the validation set (D).
Official websites use .gov
A
.gov website belongs to an official
government organization in the United States.
Secure .gov websites use HTTPS
A lock (
) or https:// means you've safely
connected to the .gov website. Share sensitive
information only on official, secure websites.
Time-dependent ROC curve analysis of the nomogram for the 12, 24, and 36 months in the training set (A) and the validation set (B). The Kaplan–Meier survival curves of the patients in the training set (C) and in the validation set (D).