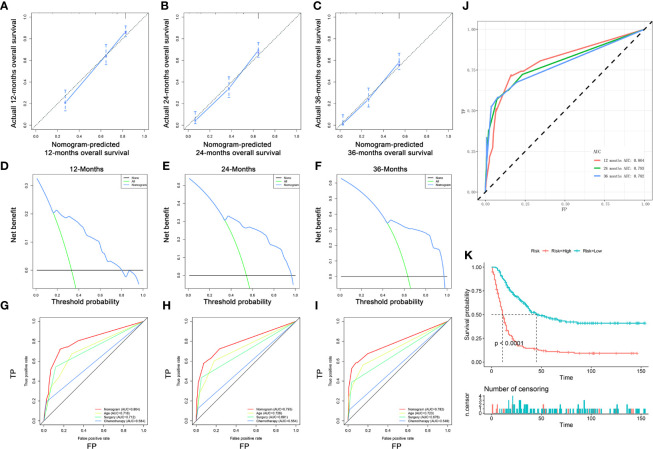
Figure 8.
Validating the prognostic nomogram in the expanded testing set. The calibration curves of the nomogram for the 12 (A), 24 (B), and 36 months (C) in the expanded testing set. The decision curve analysis of the nomogram for the 12 (D), 24 (E), and 36 months (F) in the expanded testing set. Comparison of area under the receiver operating characteristic curves between nomogram and all independent factors for the 12 (G), 24 (H), and 36 (I) months in the expanded testing set. (J) Time-dependent ROC curve analysis of the nomogram for the 12, 24, and 36 months in the expanded testing set. (K) The Kaplan–Meier survival curve of the patients in the expanded testing set.

