
Figure 2.
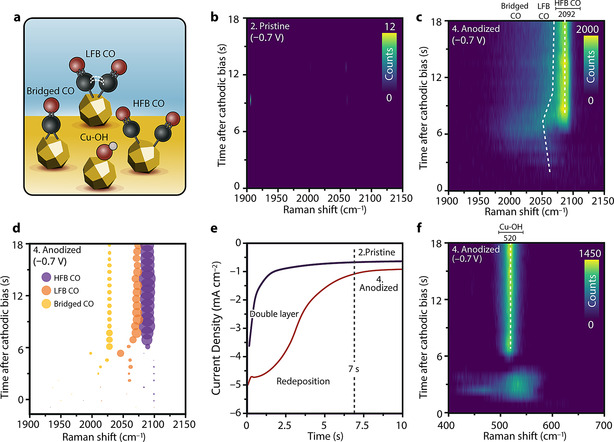
a) Surface species corresponding to the Raman signals observed in this Figure. b) TR‐SERS heatmap of pristine Cu‐MP during reduction at −0.7 V in the CO region (Raman shift between 1900–2150 cm−1). c) TR‐SERS heatmap of anodized Cu‐MP during reduction at −0.7 V in the CO region (Raman shift between 1900–2150 cm−1), showing the dynamic behavior of adsorbed CO. d) Fitted result of (c), allowing for deconvolution of the Raman spectra into three bands: high‐frequency band CO (HFB, blue bubbles), low‐frequency band CO (LFB, orange bubbles) and bridged CO (yellow bubbles). Bubble positions show time and Raman shift, and bubble sizes are proportional to peak intensities. The color bars of the heatmaps are based on the photon counts of the Raman spectra. e) Chronoamperometry (CA) curve of pristine and anodized Cu‐MP during reduction at −0.7 V in the first 10 s (full data is shown in Figure S11), showing the current associated with redeposition of leached Cu after anodic treatment. f) TR‐SERS heatmap of anodized Cu‐MP during reduction at −0.7 V in the copper oxide and Cu‐OH region (Raman shift between 400–700 cm−1), showing the formation of Cu‐OH (peak at 520 cm−1) after 7 s of cathodic bias. Electrolyte: flowing CO2‐saturated 0.1 M KHCO3 aqueous solution, pH 6.8. Raman spectra interval: 717 ms.