
Figure 3.
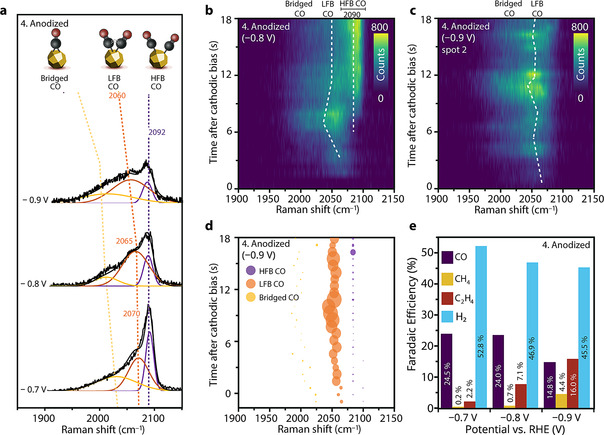
a) Comparison of steady‐state Raman spectra (15 min after reduction) of anodized Cu‐MP during reduction at −0.7 V, −0.8 V and −0.9 V. Collection time is 5 s. b) TR‐SERS heatmap of anodized Cu‐MP during reduction at −0.8 V in the CO region (Raman shift between 1900–2150 cm−1). After 7 s, an intense high‐frequency band CO (HFB‐CO) is observed. c) TR‐SERS heatmaps of anodized Cu‐MP during reduction at −0.9 V in the CO region (Raman shift between 1900–2150 cm−1), showing that the low‐frequency band CO (LFB‐CO) is highly dynamic. d) Fitted result of (c), showing the increased contribution of LFB‐CO to the spectrum at −0.9 V. Bubble position shows time and Raman shift, and bubble size is proportional to peak intensity. e) FE of anodized Cu‐MP during CO2RR at −0.7 V, −0.8 V and −0.9 V. The color bars of the heatmaps are based on photon counts of Raman spectra. Electrolyte: CO2‐saturated 0.1 M KHCO3 with CO2 bubbling, pH 6.8. Raman spectra interval for TR‐SERS: 717 ms.