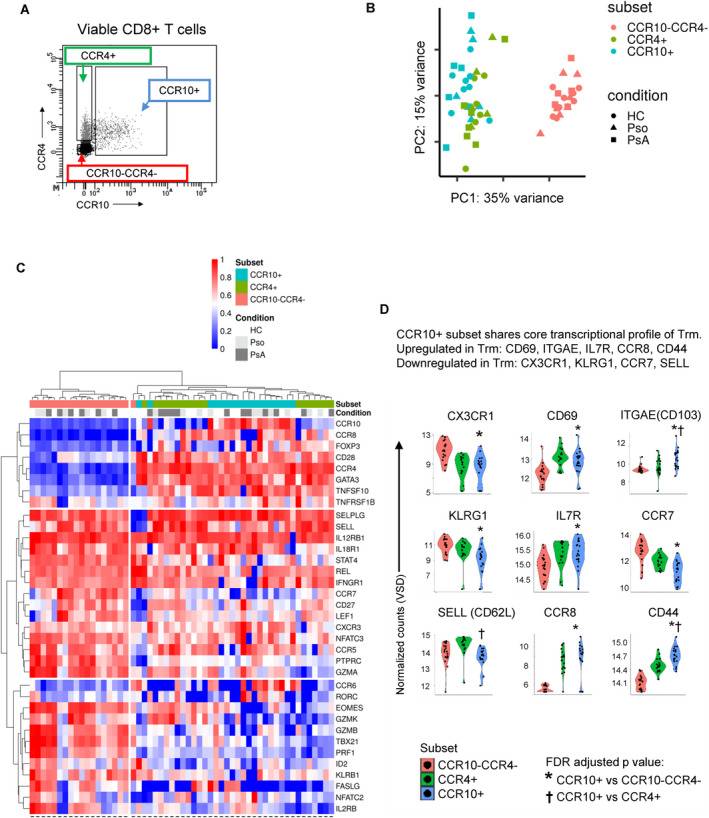
Figure 4.

CD8+CCR10+ T cells express GATA3 and FOXP3 and exhibit a tissue‐resident memory (Trm) cell profile. A, Three different subsets of CD8+ T cells were flow sorted based on the presence/absence of CCR10 and CCR4. Detailed data regarding the full gating strategy are shown in Supplementary Figure 5 (http://onlinelibrary.wiley.com/doi/10.1002/art.41652/abstract). B, Principal components (PC) analysis was performed based on preselection of 5,268 genes that were differentially expressed in any of the cell subsets (nominal P < 0.05). C, Heatmap shows expression levels, on CD8+ cell subsets from healthy controls (HCs) and patients with psoriasis (Pso) or psoriatic arthritis (PsA), of genes previously reported as being critical for CD8+ T cells. D, Violin plots indicate the main transcriptional features attributed to Trm cells. Expression on the CCR10+ subset was compared to expression on the CCR10−CCR4− subset and the CCR4+ subset. VSD = variance‐stabilized data; FDR = false discovery rate.
