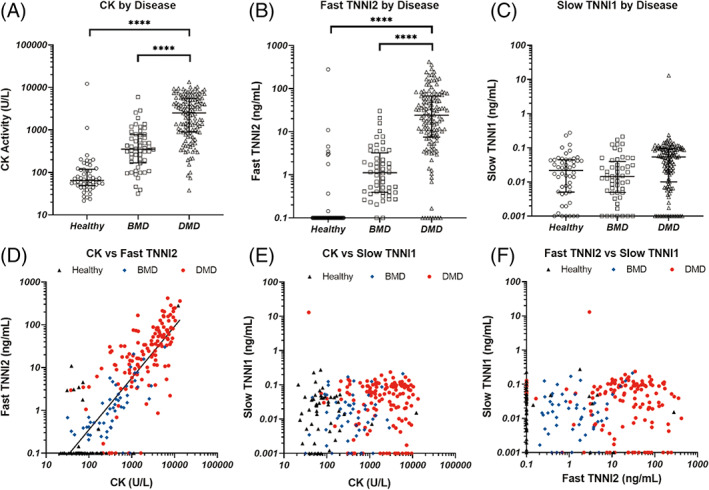
FIGURE 1.

Plasma concentrations of CK enzymatic activity (A), TNNI1 (B), and TNNI2 (C) were measured in samples from BMD patients (squares) and DMD patients (triangles), with HV as controls (circles). In each panel, the error bars represent the median +/− the interquartile range. In panels (B) and (C), samples that exhibited no detectable TNNI concentration were assigned values equal to the assay's limit of detection (0.1 ng/mL and 0.001 ng/mL for fast and slow TNNI, respectively) When compared with each other, a significant correlation was found between CK and fast TNNI2 (D), with an R2 of 0.67. There was no significant correlation between CK and slow TNNI1 (E) nor between fast TNNI2 and slow TNNI1 (F) In panels (D) – (F), healthy samples are represented as black triangles, BMD as blue diamonds, and DMD red circles. ****: P < .0001. All other comparisons are non‐significant
