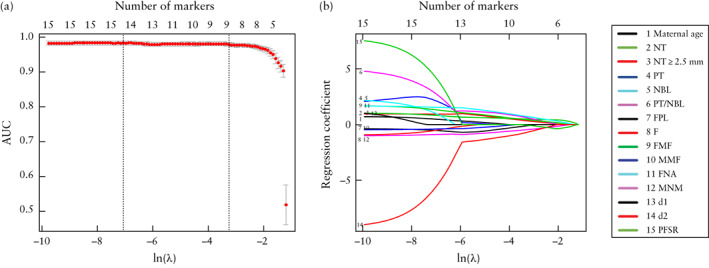
Figure 3.

Selection from 15 potential markers of most useful predictive markers for trisomy 21 by least absolute shrinkage and selection operator (LASSO) method. Top x‐axes represent number of selected markers and bottom x‐axes represent penalty parameter ln(λ). (a) Illustration of relationship between area under receiver‐operating‐characteristics curve (AUC) of prediction model (LASSO model) and number of markers in the model. Vertical dotted line on right is at optimal value of ln(λ) (−3.44), at which nine markers were selected. Interval between left and right vertical dotted lines represents the range of good values for ln(λ). (b) Illustration of relationship between regression coefficients of markers and penalty parameter ln(λ). d1, distance between anterior edge of frontal bone and anterior edge of prefrontal skin; d2, distance between anterior edge of prefrontal skin (at same point as d1 measurement) and mandibulomaxillary line; F, largest perpendicular distance between facial profile line and outermost part of frontal bone; FMF, frontomaxillary facial angle; FNA, frontonasal facial angle; FPL, facial profile line; MMF, mandibulomaxillary facial angle; MNM, maxilla‐nasion‐mandible angle; NBL, nasal bone length; NT, nuchal translucency thickness; PFSR, prefrontal space ratio; PT, prenasal thickness; PT/NBL, prenasal‐thickness‐to‐nasal‐bone‐length ratio.
