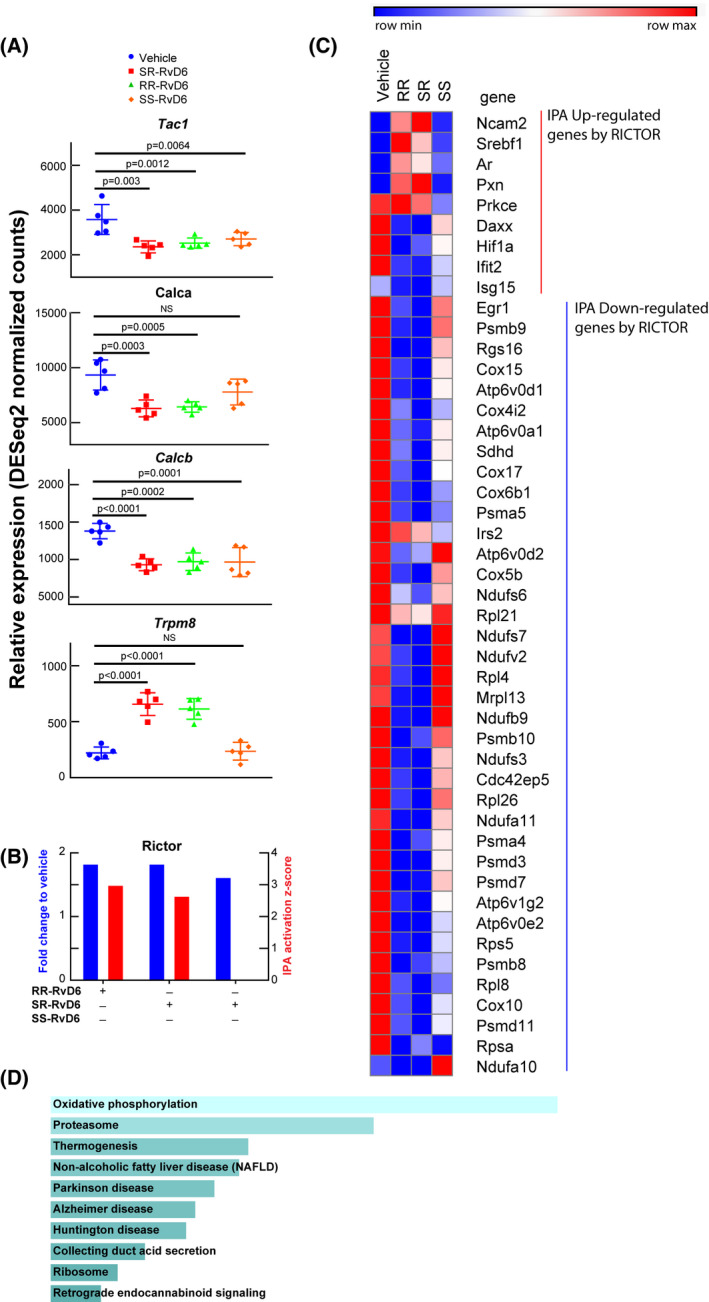
FIGURE 4.

Transcriptome signature in the trigeminal ganglion unravels the role of RvD6 isomers. A, RNA‐seq normalized counts of genes involved in inflammation and pain, including Tac1, Calca, Calcb, and Trpm8. The p values are derived from ANOVA post hoc Dunnett's multiple comparisons test with vehicle as a reference. Mean and SD are depicted as the lines. Each data point represents an ipsilateral TG of a mouse. B, The Rictor signaling activated by RvD6 isomers. The blue columns represent the relative normalized fold changes of Rictor gene analyzed by RNA‐seq, while the red columns represent the activation z‐score of Rictor signaling predicted by IPA using RNA‐seq data as input. The SS‐RvD6 z‐score was insufficient to show the activation of RICTOR pathway in the IPA. C, The RNA‐seq normalized counts heatmap of RICTOR regulated genes. The genes activated (red) and inhibited (blue) are grouped and clustered across all treatment groups. There are about 5 upregulated genes and 36 downregulated genes by SR‐and RR‐RvD6. D, The KEGG‐pathway prediction of RICTOR downregulated genes from C. Bars were sorted by p value. The length of the bar represents the significance of the pathway, while the lighter the color, the higher the significance
