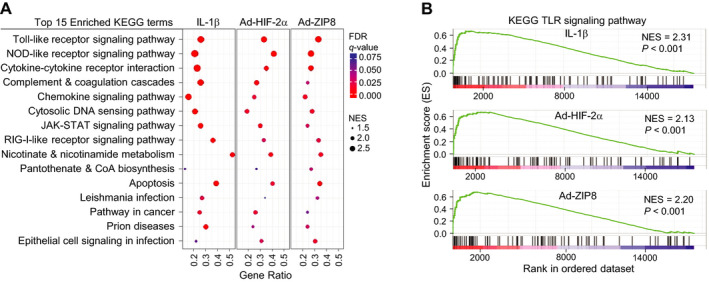
Figure 1.

Transcriptional profiling of mouse chondrocytes treated with osteoarthritis‐associated pathogenic catabolic factors. Microarray data were obtained from primary‐culture mouse articular chondrocytes that had been treated for 36 hours with interleukin‐1β (IL‐1β) (1 ng/ml) or infected with 800 multiplicities of infection of control adenovirus, Ad‐HIF‐2α, or Ad‐ZIP8. A, Enrichment plot of the top 15 most significant KEGG terms with normalized enrichment scores (NES). Gene ratio is the number of core enriched genes divided by number of genes in a given KEGG gene set after filtering out the genes that were not found in the expression data set. B, Gene set enrichment analysis of microarray signals on KEGG pathways. NOD = nucleotide‐binding oligomerization domain; RIG‐1 = retinoic acid–inducible gene 1; CoA = coenzyme A; FDR = false discovery rate; TLR = Toll‐like receptor.
