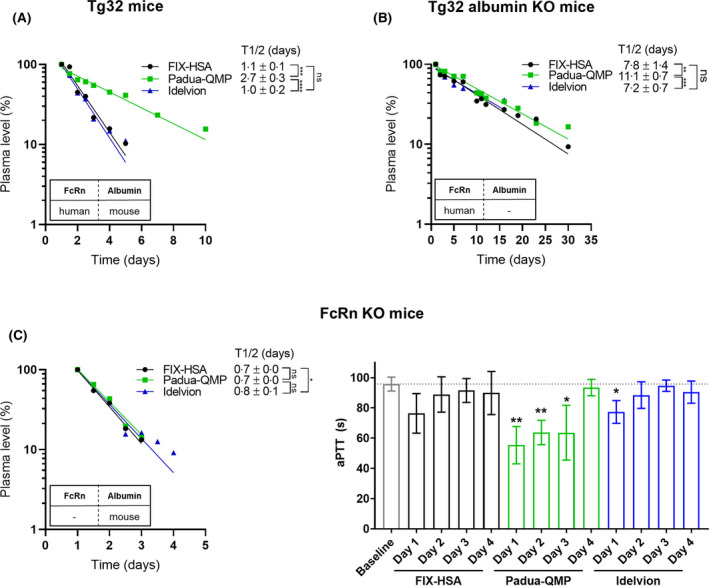
Fig 3.

FcRn extends the plasma half‐life of the engineered Padua‐QMP fusion. Clearance curves of FIX‐HSA (black circles), Padua‐QMP (green squares) and Idelvion (blue triangles) in hFcRn transgenic mice (Tg32) (A), hFcRn transgenic mice deficient for mouse albumin (Tg32 albumin KO) (B), and FcRn deficient mice (FcRn KO) (C, left panel). Plasma samples from FcRn KO mice were also evaluated for FIX‐dependent shortening of coagulation times (C, right panel). The mice received 2 mg/kg fusion protein by intravenous injection. Plasma levels are reported as the percentage remaining in the circulation compared to the level measured 24 h after injection (day 1, 100%). The values represent the mean ± standard deviation (SD) of 3–5 mice. Mean β‐phase half‐life (t1/2) ± SD is reported in days and shown in the upper right corner of each figure. The corresponding P values are indicated as not significant (ns, P > 0·05), *(P ≤ 0·05), **(P ≤ 0·01), ***(P ≤ 0·001), ****(P < 0·0001), by unpaired t‐test. P values from unpaired t‐test on in vivo half‐life data are reported in Table SII. FIX, factor IX; HSA, human serum albumin; hFcRn, human neonatal Fc receptor; KO, knock‐out.
