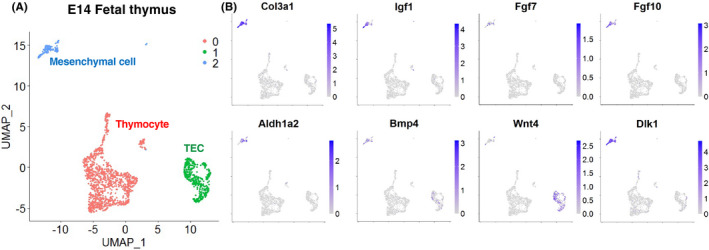
FIGURE 3.

Single‐cell transcriptome of fetal thymic cells. (A) Two‐dimensional representation of E14 fetal thymic cells. Data from the Gene Expression Omnibus (GEO) database under accession no. GSE107910 were used for UMAP clustering.66 Each dot represents a single cell. The full source code for analysis is available in GitHub (https://github.com/nittatakeshi/ImmunolRev_Fig3). (B) Expression profiles of the genes which are known to control fetal TEC differentiation and expansion. Col3a1 was used as a marker of mesenchymal cells
