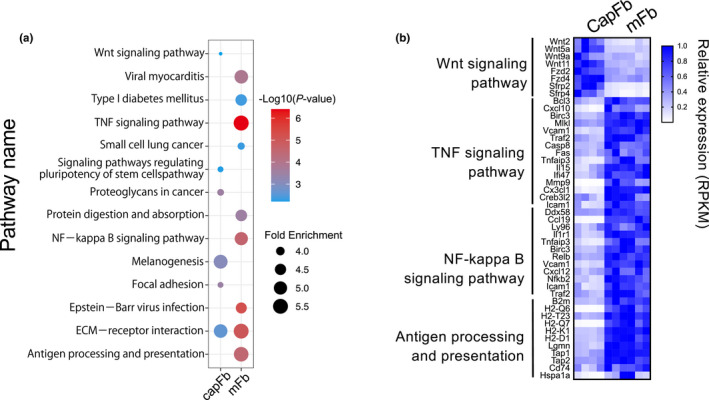
FIGURE 5.

Gene expression profiling of capFbs and mFbs by whole transcriptome analysis. (A) KEGG pathway analysis of genes differentially expressed in capFbs and mFbs. Genes highly expressed in capFbs (capFbs/mFbs > 2, mean RPKM of capFbs > 10, P <.05) or in mFbs (mFb/capFb > 2, mean RPKM of mFb > 10, P <.05) were collected from bulk RNA‐seq data (GEO accession no. GSE147357)72 and subjected to KEGG pathway enrichment analysis using DAVID 6.8. (B) Heat map showing the relative expression of genes categorized as being in the Wnt signaling pathway, TNF signaling pathway, and NF‐κB signaling pathway, as well as antigen processing and presentation
