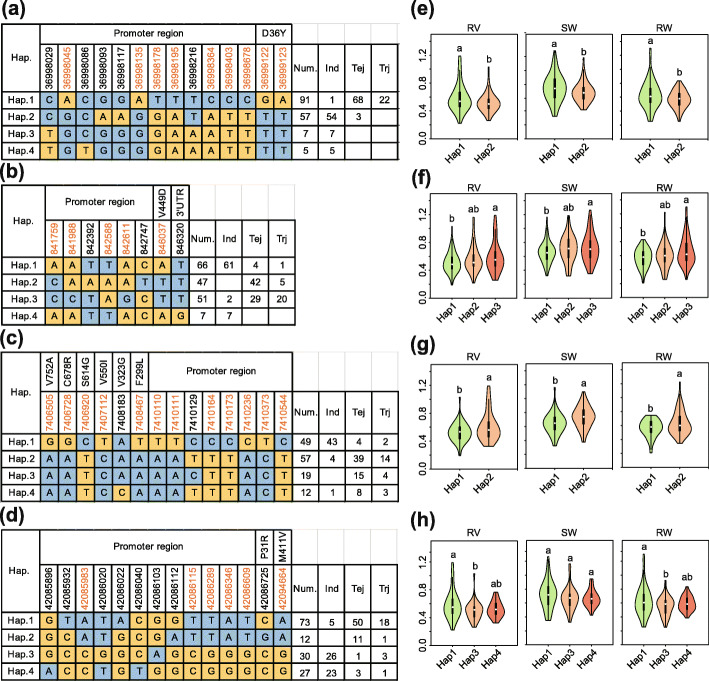
Fig. 4.
Haplotype analyses of OsAUX1, OsCd1, OsHMA3 and OsCLT1. Gene structures (left) and RV, SW and RW of different haplotypes (right) of (a, e) OsAUX1 (LOC_Os01g63770) for qSRL1.1/qRV1.3/qSL1.3, (b, f) OsCd1 (LOC_Os03g02380) for qSW3.1/qRW3.1, (c, g) OsHMA3 (LOC_Os07g12900) for qRW7.1, and (d, h) OsCLT1 (LOC_Os01g72570) for qSW1.1/qRW1.2. Brown colored numbers indicate the key SNPs that occurred in major haplotypes and resulted in significant differences of CGR indices. The violin map was constructed in R. Student’s t-tests were used to determine p-values (p < 0.05). Num, number of accessions; Ind, indica; Tej, temperate japonica; trj, tropical japonica

