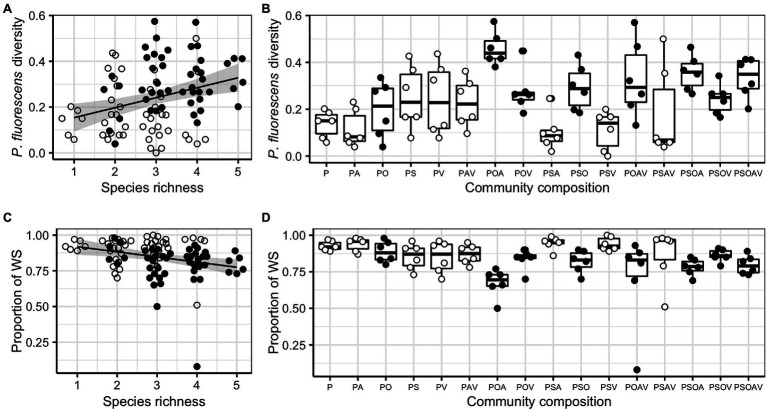
Figure 3.
The effect of species richness, the presence of Ochrobactrum sp. (O) and community composition on Pseudomonas fluorescens diversity (A,B) and the proportion of wrinkly spreader (WS; C,D). For both responsive variables, regression lines showed significant linear relationships with species richness: , F1,94 = 369.820, p < 0.001, adjusted R2 = 0.088 (A); and , F1,94 = 8.061, p = 0.006, adjusted R2 = 0.069 (B). Shaded areas around lines show the 95% confidence intervals. Treatments containing O (filled dots) and not containing O (open dots) are highlighted to show the sampling effect of O. Tops and bottoms of the bars represent the 75th and 25th percentiles of the data, the middle lines are the medians, and the whiskers extend from their respective hinge to the smallest or largest value no further than 1.5 × interquartile range.

