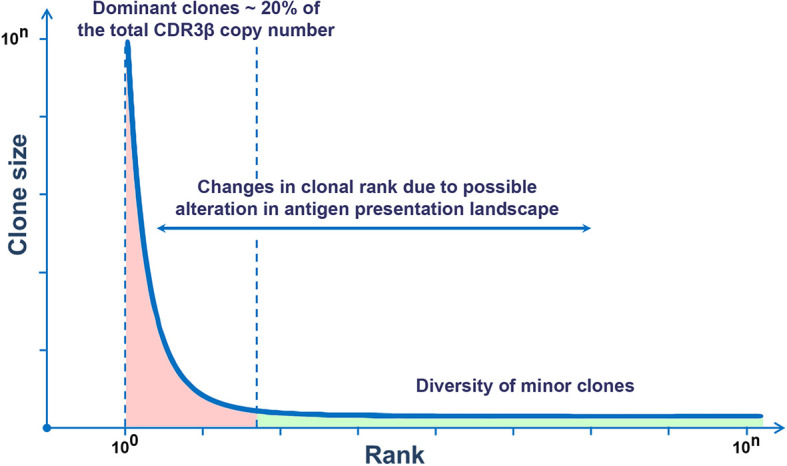
Figure 1.

Rank–size frequency distribution follows a power-law distribution. This graph demonstrates the ranking of TCR clones by sizes. To the left, there are few dominant clones (red), and to the right, there is the long tail reflecting a multitude of minor clones (green).
