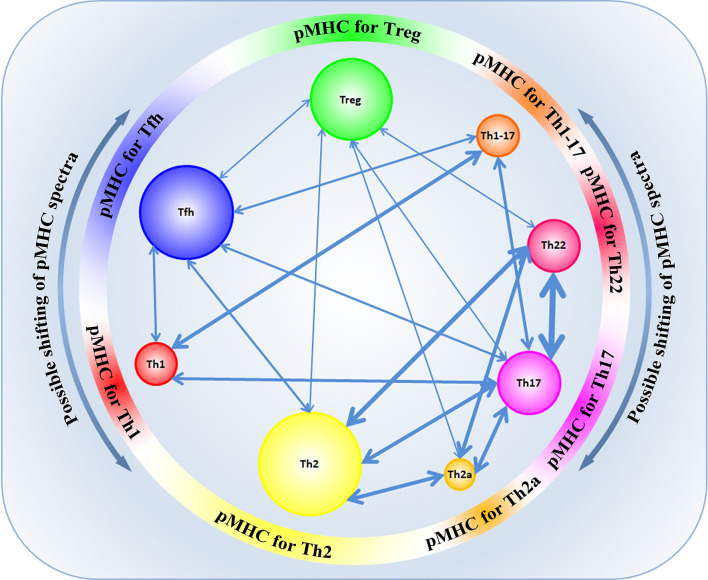
Figure 3.
The landscape of presentation shapes different CD4+ subpopulations according to their CDR3 physicochemical properties and specificity. Possible shifts in pMHC spectra can contribute to transdifferentiation between some subpopulations of CD4+ T cells. The width of the arrows reflects the number of common TCR clonotypes between subpopulations.

