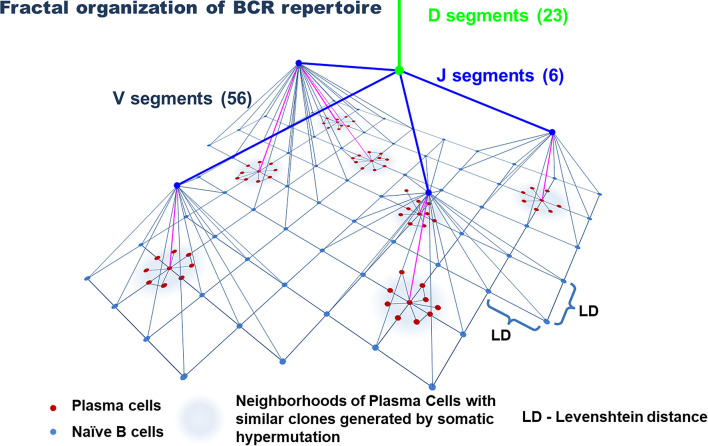
Figure 4.
Model of the organization of the B-cell repertoire. Tree-like structures generated by VDJ recombination and nucleotide additions/deletions and a star-like structure for plasma cells likely generated by somatic hypermutation. The uniform distribution of naive B cells in the similarity layer schematically reflects a homogeneously interconnected network (by Levenshtein distances) of these cells, in contrast to plasma cells, that form highly interconnected subnetworks of similar clones. The number of V, D, and J segments is indicated for the IgH chain.

