
Fig. 6. Tissue-specific priming of synNotch-CAR T cells by brain-specific antigen MOG induces effective killing of GBM6 brain tumors in vivo.
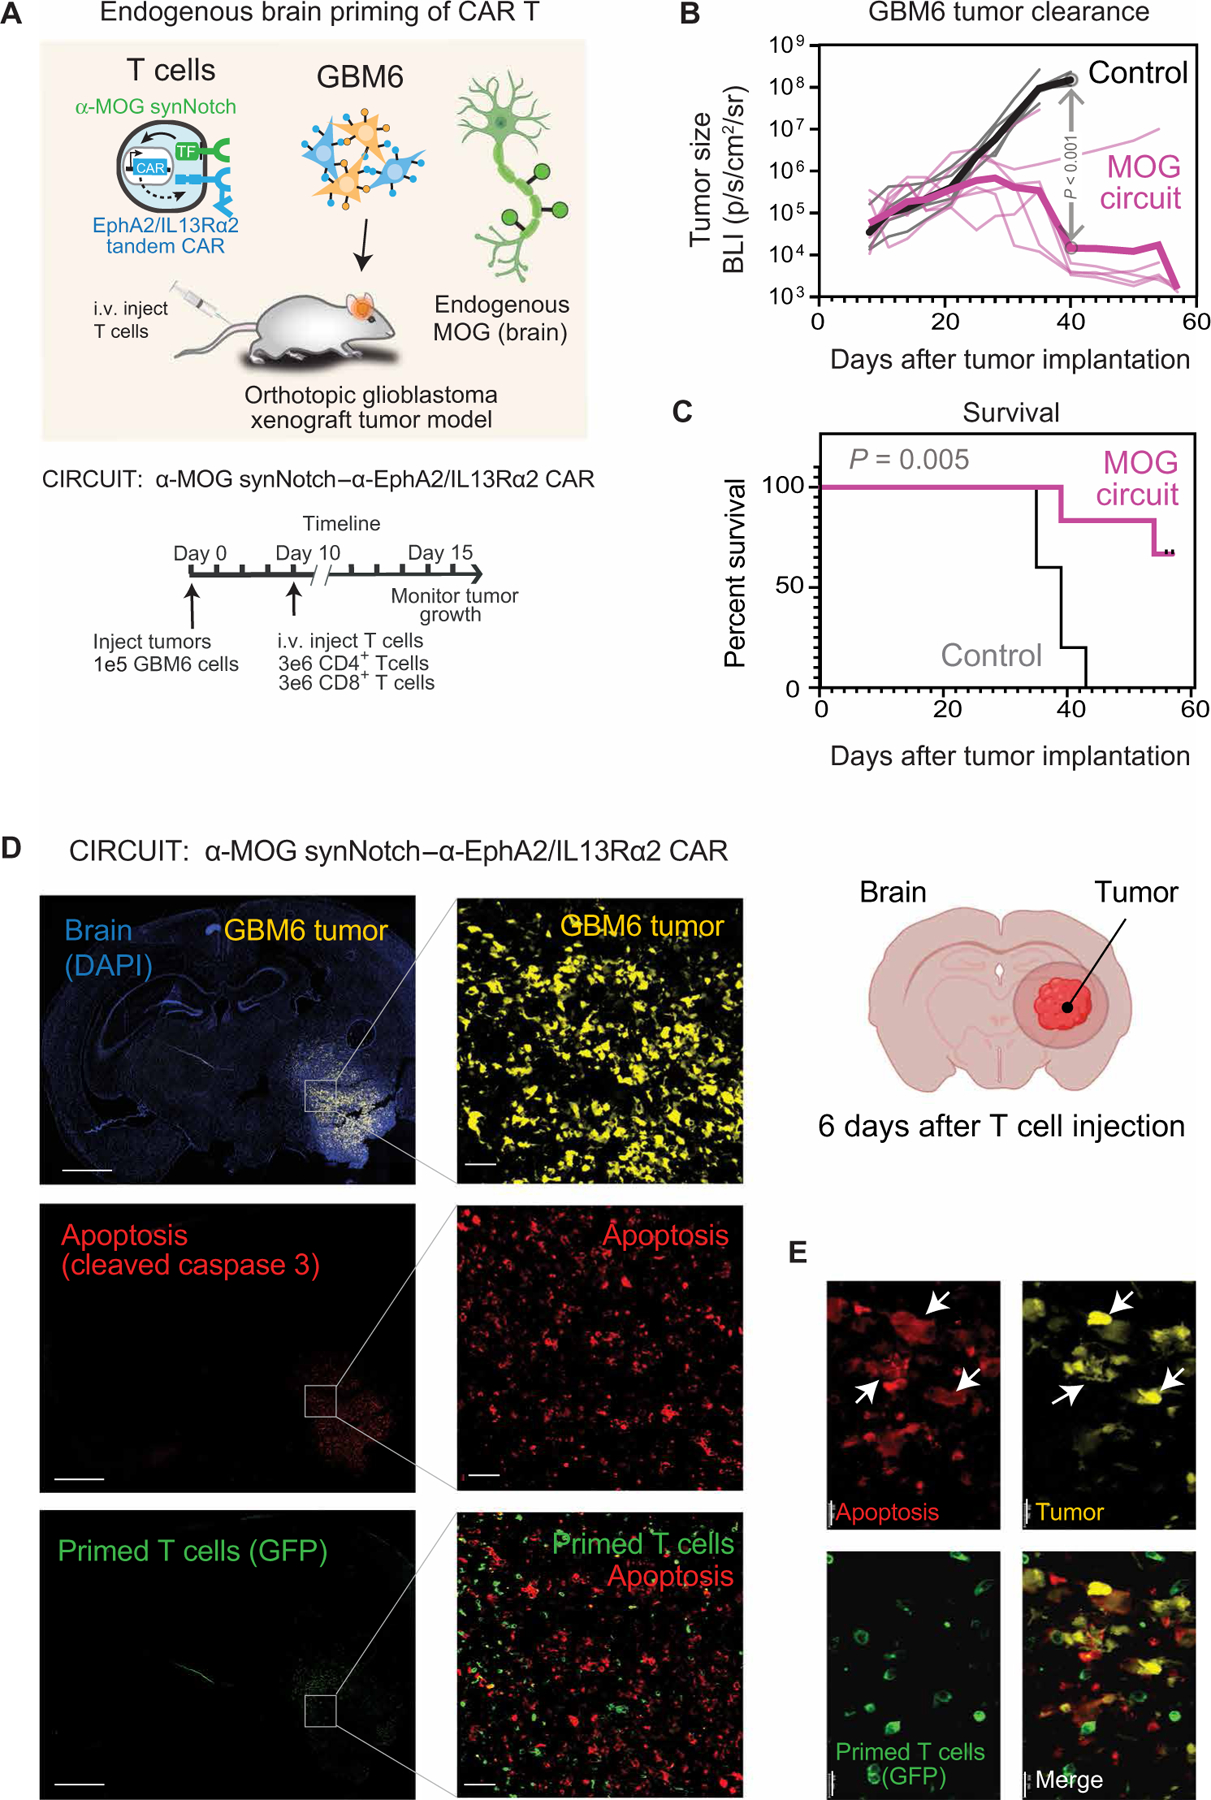
(A) GBM6 tumor cells were stereotactically implanted into brains of NCG mice. GBM6 cells were engineered to express mCherry and luciferase to allow for tracking of tumor size. Ten days after tumor implantation, mice were infused intravenously with 3 million each of CD4+ and CD8+ T cells. T cells expressed either no construct (nontransduced control) (n = 5) or α-MOG synNotch–α-EphA2/IL13Rα2 CAR circuit (n = 6). (B and C) Tumor size (B) and survival (C) were monitored over time. Tumor size was determined by bioluminescence imaging. Negative control treatment (nontransduced T cells) is shown in gray, and α-MOG SynNotch-CAR circuit treatment is shown in pink. P < 0.001 by t test with Holm-Sidak correction for multiple comparisons (on day 40). Thin lines show traces for individual animals; thick line shows geometric mean. See fig. S9G for analysis of off-target specificity (using non–brain-implanted tumor). Survival was analyzed over 60 days by log-rank (Mantel-Cox) test. P = 0.005. (D) GBM6 tumor–bearing mice were euthanized 6 days after α-MOG SynNotch-CAR T cell infusion. Representative confocal fluorescent microscopy of brain sections reveals that T cell–mediated killing (cleaved caspase 3 staining) is restricted to the tumor. Scale bars, 2 mm (left) and 50 µm (right). (E) Insets (single-stained images) are enlargements of outlined regions in main images. Expression of cleaved caspase 3 is confined to the tumor cells (yellow), as indicated by white arrows in the overlay image. Scale bar, 20 µm.