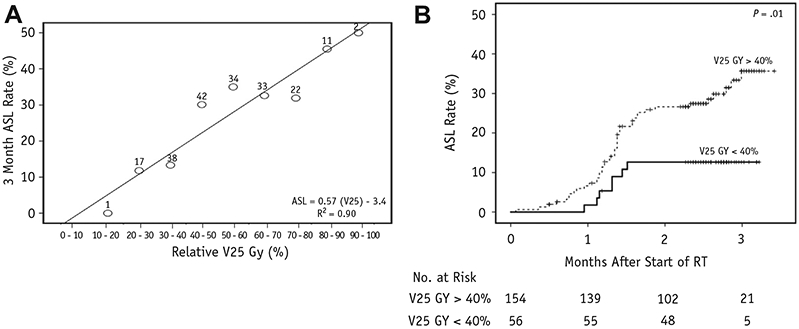
Fig. 3.

(A) Dose—response plot of brain V25 Gy (brain volume receiving 25 Gy) and 3-month acute severe lymphopenia (ASL) rate. Number above each data point denotes the sample size of that dose range. Linear regression equation estimates the risk of ASL for any given brain V25 Gy. (B) ASL rate stratified by V25 Gy greater than or less than 40%. Abbreviation: RT = radiation therapy.
