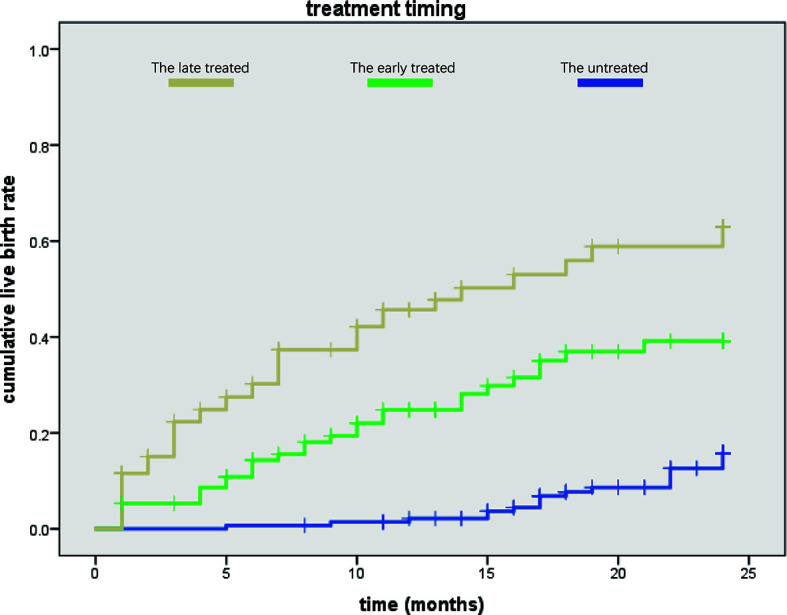
Figure 2.

Comparison of the three groups in cumulative live birth rate. The late-treatment group is shown in yellow color, the early-treatment group is shown in green, and the untreated group is shown in blue. We found that the late-treatment group had higher cumulative live birth rate than the other two groups, while the cumulative live birth rate of the untreated group was lowest according to treated time.
