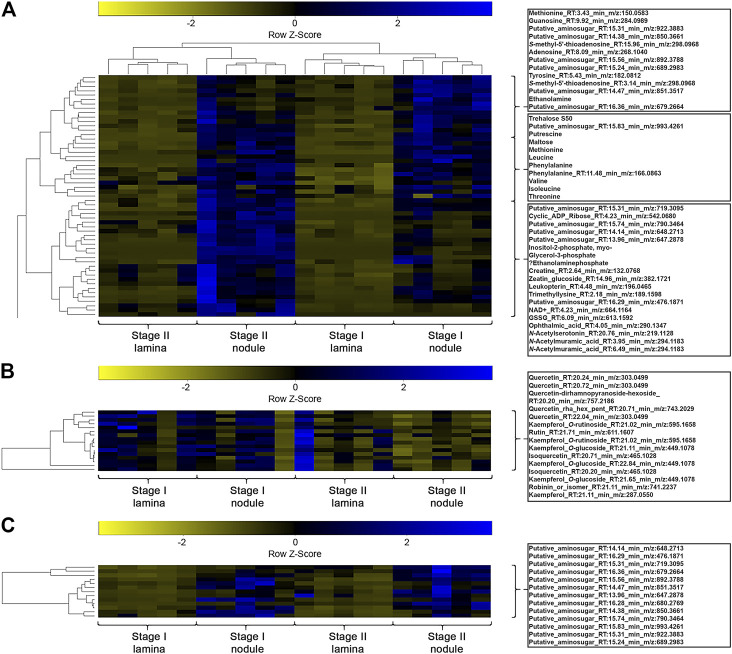
FIGURE 5.
(A) Heatmap of a hierarchical bicluster analysis of statistically significant changed nodule specific metabolites of Psychotria punctata tissue extracts (selected metabolite names do not corresponds with rows). The columns correspond to the five biological replicates of each condition. (B) Heatmap of a hierarchical cluster analysis of m/z features annotated as flavonoids of P. punctata tissue extracts. The columns correspond to the five biological replicates of each condition. (C) Heatmap of a hierarchical cluster analysis of m/z features annotated as anhydromuropeptdides of P. punctata tissue extracts. The columns correspond to the five biological replicates of each condition.

