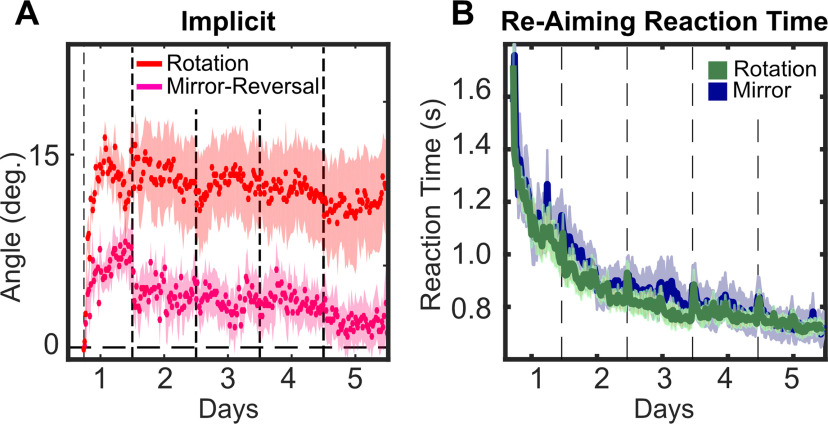
Figure 13.
Comparison between subjects in experiment 1 (rotation) and experiment 2 (mirror reversal). The vertical dashed lines represent first the onset of the perturbation, then day break. The shaded areas represent the SEM. A, Time course of the implicit process measured via subtraction from explicit re-aiming during training. B, Reaction time across training calculated as interval from target onset to re-aim registered. Because re-aiming was introduced right before perturbation onset, the time course starts when the perturbation was initiated.

