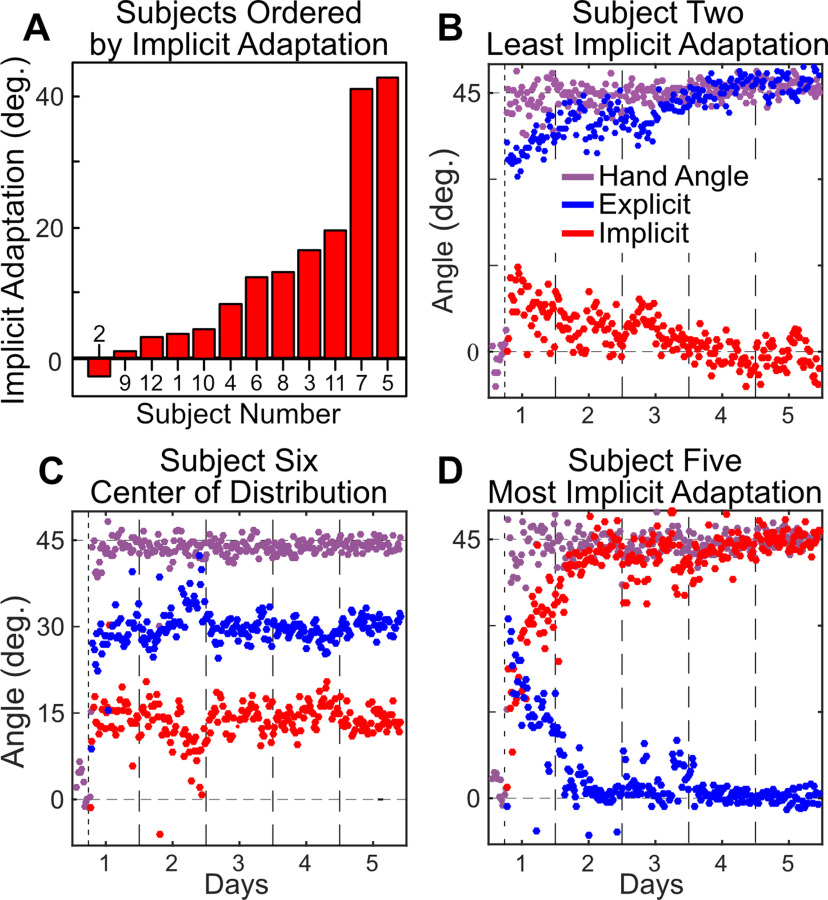
Figure 4.
A, Bar graph ordering subjects by the average amount of the implicit process as calculated from the last 200 trials of day 5. B, Subject (#2) reporting the most explicit re-aiming at the end of learning, assumed to have the least implicit process learning (i.e., aiming directly at the solution with no perceptible implicit process at the end of day 5). C, Subject (#6) taken from the center of the distribution. D, Subject (#5) reporting the least explicit re-aiming (i.e., aiming at or very near to the target with all learning accounted for by the implicit process).

