Figure 2.

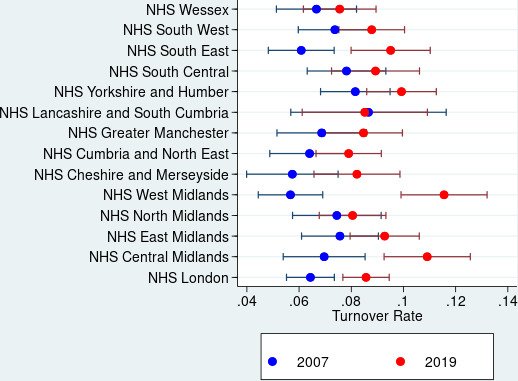
Comparison of general practitioners turnover rate according to National Health Service (NHS) region 2007 versus 2019. The proportion of practices on y-axis has not been multiplied by 100.

Comparison of general practitioners turnover rate according to National Health Service (NHS) region 2007 versus 2019. The proportion of practices on y-axis has not been multiplied by 100.