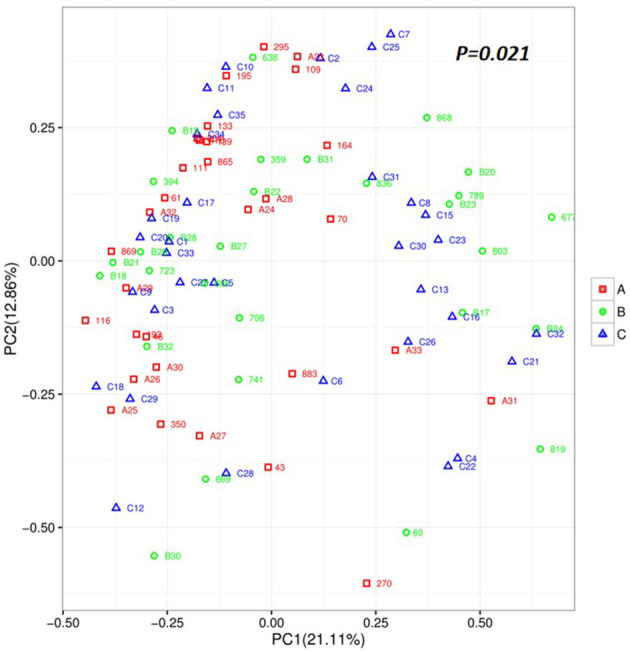
Figure 2.

Unweighted based on the distance matrix of UniFrac dissimilarity of the faecal microbial communities in the Acute set stage group, Remission stage group, and Healthy control groups. Respective R-values show the community variation between the compared groups, and significant P-values are indicated. Acute stage group (red), Remission stage group (green), and Healthy group (blue). PC, principal coordinate.
