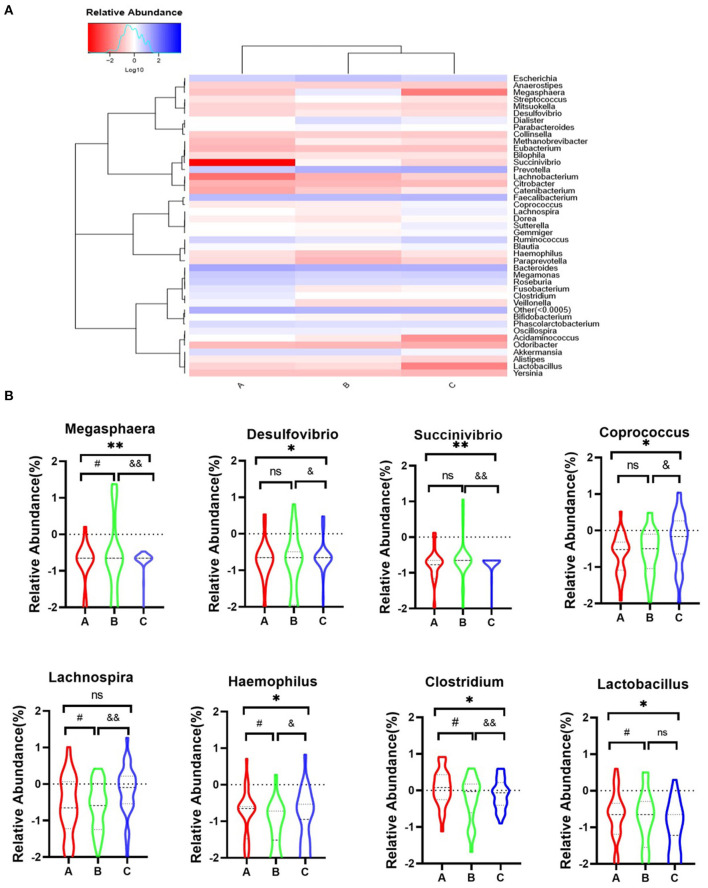
Figure 4.
Heatmap representation of genus level of gut microbiota in three groups. (A) Heatmap of the 42 most counts abundant taxa. On top of the heatmap, group of samples are colour-coded. (B) A, Acute set stage group; B, Remission stage group; C, Healthy control group. *PA−C ≤ 0.05, **PA−C ≤ 0.001, #PA−B ≤ 0.05, &PB−C ≤ 0.05, and &&PB−C ≤ 0.001.

