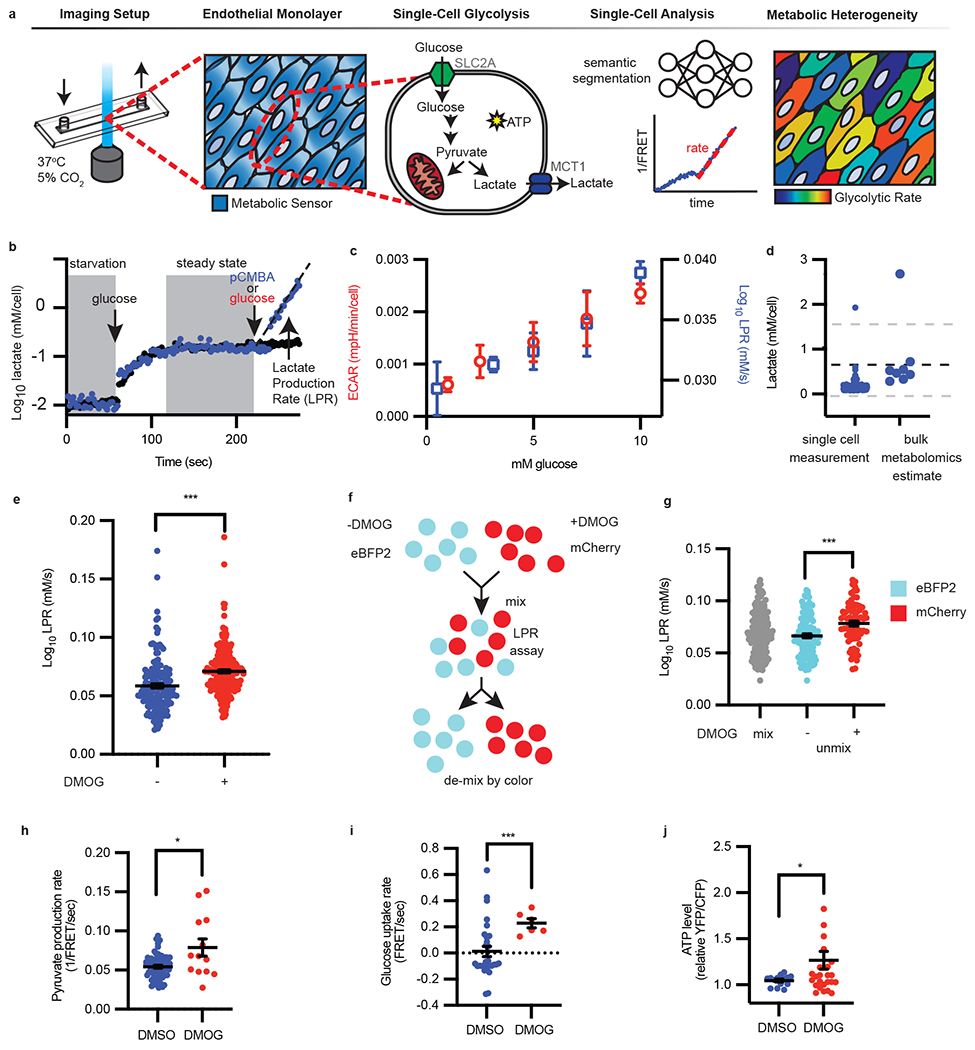
Figure 1: Single-cell lactate production rate (LPR) distinguishes metabolically heterogeneous subpopulations.

a, Schematic of single-cell metabolism quantification by deep learning. Endothelial cells were plated into imaging chambers capable of fluid exchange with controlled temperature and CO2. Once endothelial cells grew to form a monolayer, metabolite sensors were genetically introduced to measure glycolysis. Within each cell, glucose is converted to pyruvate and consumed by mitochondria or fermented into lactate and exported via MCT1, thus generating ATP. Deep learning-enabled semantic segmentation was used for linking cells into a 1/FRET time series for quantification of intracellular lactate over time to reveal metabolic heterogeneity. b, Following starvation, glucose was injected followed by glucose and MCT1 inhibitor pCMBA (blue dots) or glucose alone (red dots). The slope (black dotted line, eye guide) of each cell is the lactate production rate (LPR), filtered for fitting with R2 values ≥ 0.9. c, Single-cell LPR and per cell ECAR vs extracellular glucose concentration (n = 7, 226, 43, 200, 206 cells for LPR left to right, n= 4, 3, 4, 3, 3 wells for ECAR left to right; error bars are SEM). d, Comparison of steady-state lactate levels (n = 167 cells) with metabolomics (n = 8). The dotted black line is the mean metabolomics (n = 8) estimate of intracellular lactate measured by mass spectrometry. Gray dotted lines are standard deviation. e, LPR of vehicle DMSO (“−“) or DMOG (“+”) treated endothelial cells (n = 164 “−”, 256 “+”; error bars were SEM, p < 0.0001). f, eBFP2 or mCherry cells were treated with DMSO or DMOG, then mixed and imaged together; g, the LPR is then deconvoluted by color (n = 166 eBFP2, n = 79 mCherry; error bars are SEM, p < 0.0001). h-j, Pyruvate production rate (h, n = 67, 13, p = 0.048), glucose uptake rate (i, n = 29, 6, p = 0.0005), and ATP levels (j, n = 14, 29, p = 0.0323) in HAECs treated overnight with DMSO or DMOG measured using genetically encoded sensors. Error bars SEM. Statistical significance was determined by two-sided Welch’s t-test.
