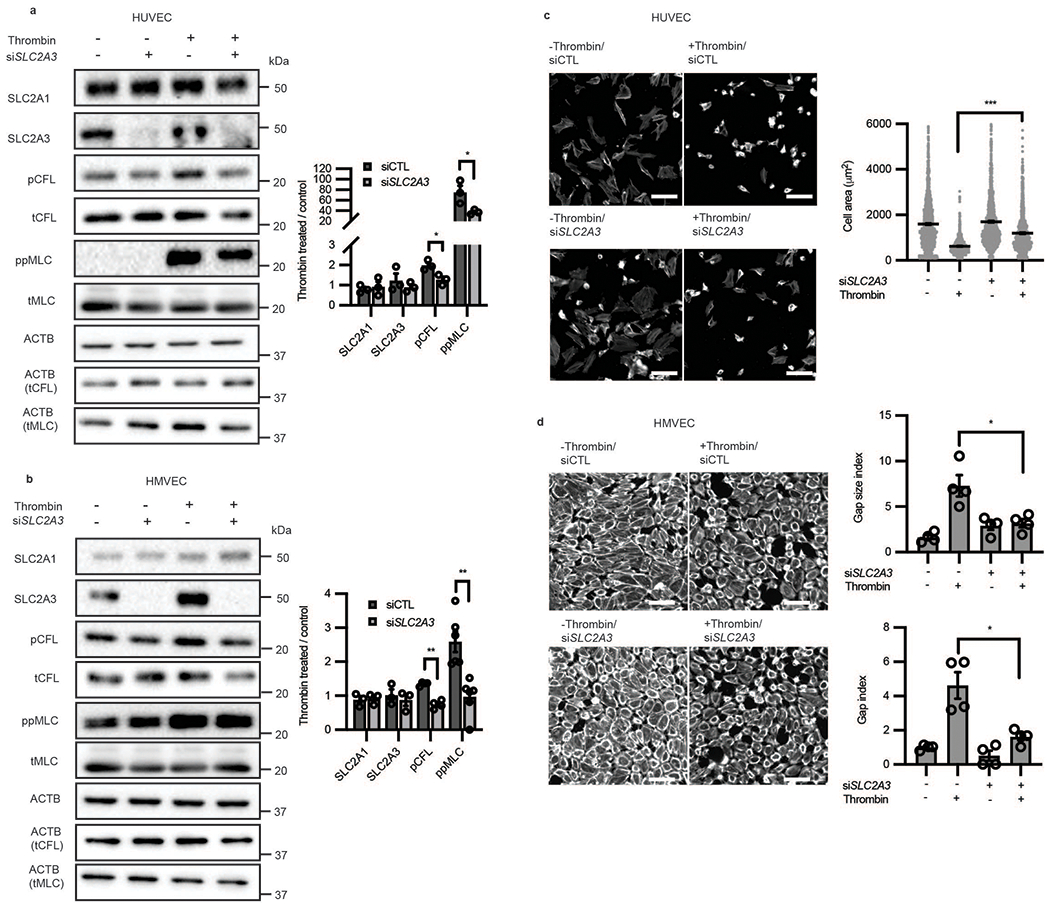
Extended Data Fig. 5. SLC2A3 inhibition abrogates thrombin-induced phosphorylation of CFL and MLC and contraction across multiple endothelial cell types.

a-b, Western blot analysis of glucose transporter expression, phosphorylated CFL, and phosphorylated MLC, in human umbilical vein endothelial cells (HUVEC, a, n = 3; biological replicates, p = 0.0257 for pCFL and 0.0414 or ppMLC) and human microvascular endothelial cells (HMVEC, b, n = 3 for SLC2A1, SLC2A3, n = 4 for CFL and n = 5 for MLC; biological replicates, p < 0.001 for pCFL and p = 0.0014 for ppMLC). Loading control for each protein is ACTB unless specifically denoted in parentheticals. Original blot in Source Data f-g. c, Representative images and cell size of contractile HUVECs subjected to thrombin stimulation in the absence or presence of SLC2A3 knockdown. (n = 1375, 1279, 760, 1162 from left to right, p < 0.0001) d, Representative images, gap size index, and gap index of contractile HMVECs subjected to thrombin stimulation in the absence or presence of SLC2A3 knockdown. Representative images are phalloidin. (n = 4 biological replicates, p = 0.0171 for gap size index and p = 0.0262 for gap index) Statistical significance determined by two-sided Welch’s t-test. All error bars are SEM.
