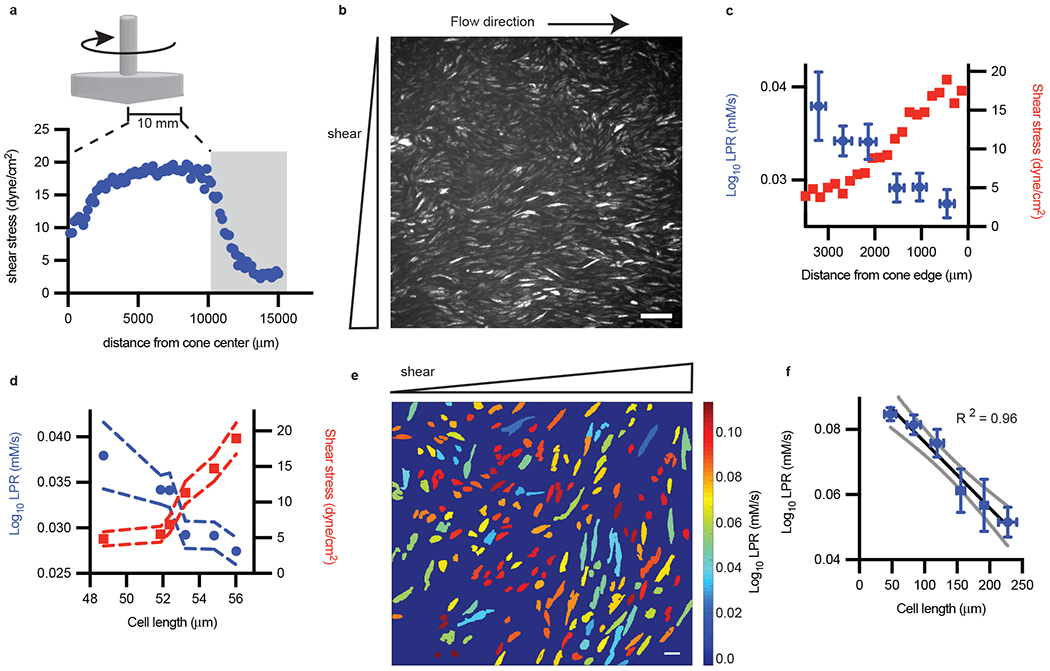
Figure 2: Endothelial LPR in response to shear stress is heterogeneous.

a, A cone and plate device was used to generate shear stress as measured by particle image velocimetry, with gray bar indicating area of interrogation. b, The corresponding laconic fluorescence image at the gray zone in a. Scale bar = 165 μm (representative of n = 3 biological replicates). c, LPR and shear stress vs distance from cone edge (n = 27, 47, 34, 34, 35, 33 left to right; error bars are SEM). d, Replot of c, with LPR and shear stress as a function of cell length, error bars are SEM. e, The LPR of segmented endothelial cells subjected to flow (color from cold to hot indicated the increase of LPR in each cell). Scale bar = 44 μm. f, Major axis cell length of endothelial cells (e) plotted against measured LPR (cell number n = 103, 47, 18, 8, 8, 4 low to high cell length; error bars are SEM). Standard deviation of regression coefficients for R2 for (f) is 0.074.
